S&P 500 Technical Analysis - A Cyclical Bear Market

The major US equity indices probably entered a bear market during Autumn 2018. Descriptive statistics show that the current cycle is at the very long end in comparison to what the US economy witnessed during the past 150 years. Moreover, a longer-term technical analysis perspective suggests that the stage is set for a cyclical correction. The selloff during the month of October 2018 may have put the lid on the market. The short-term trend probably turned bearish as well.
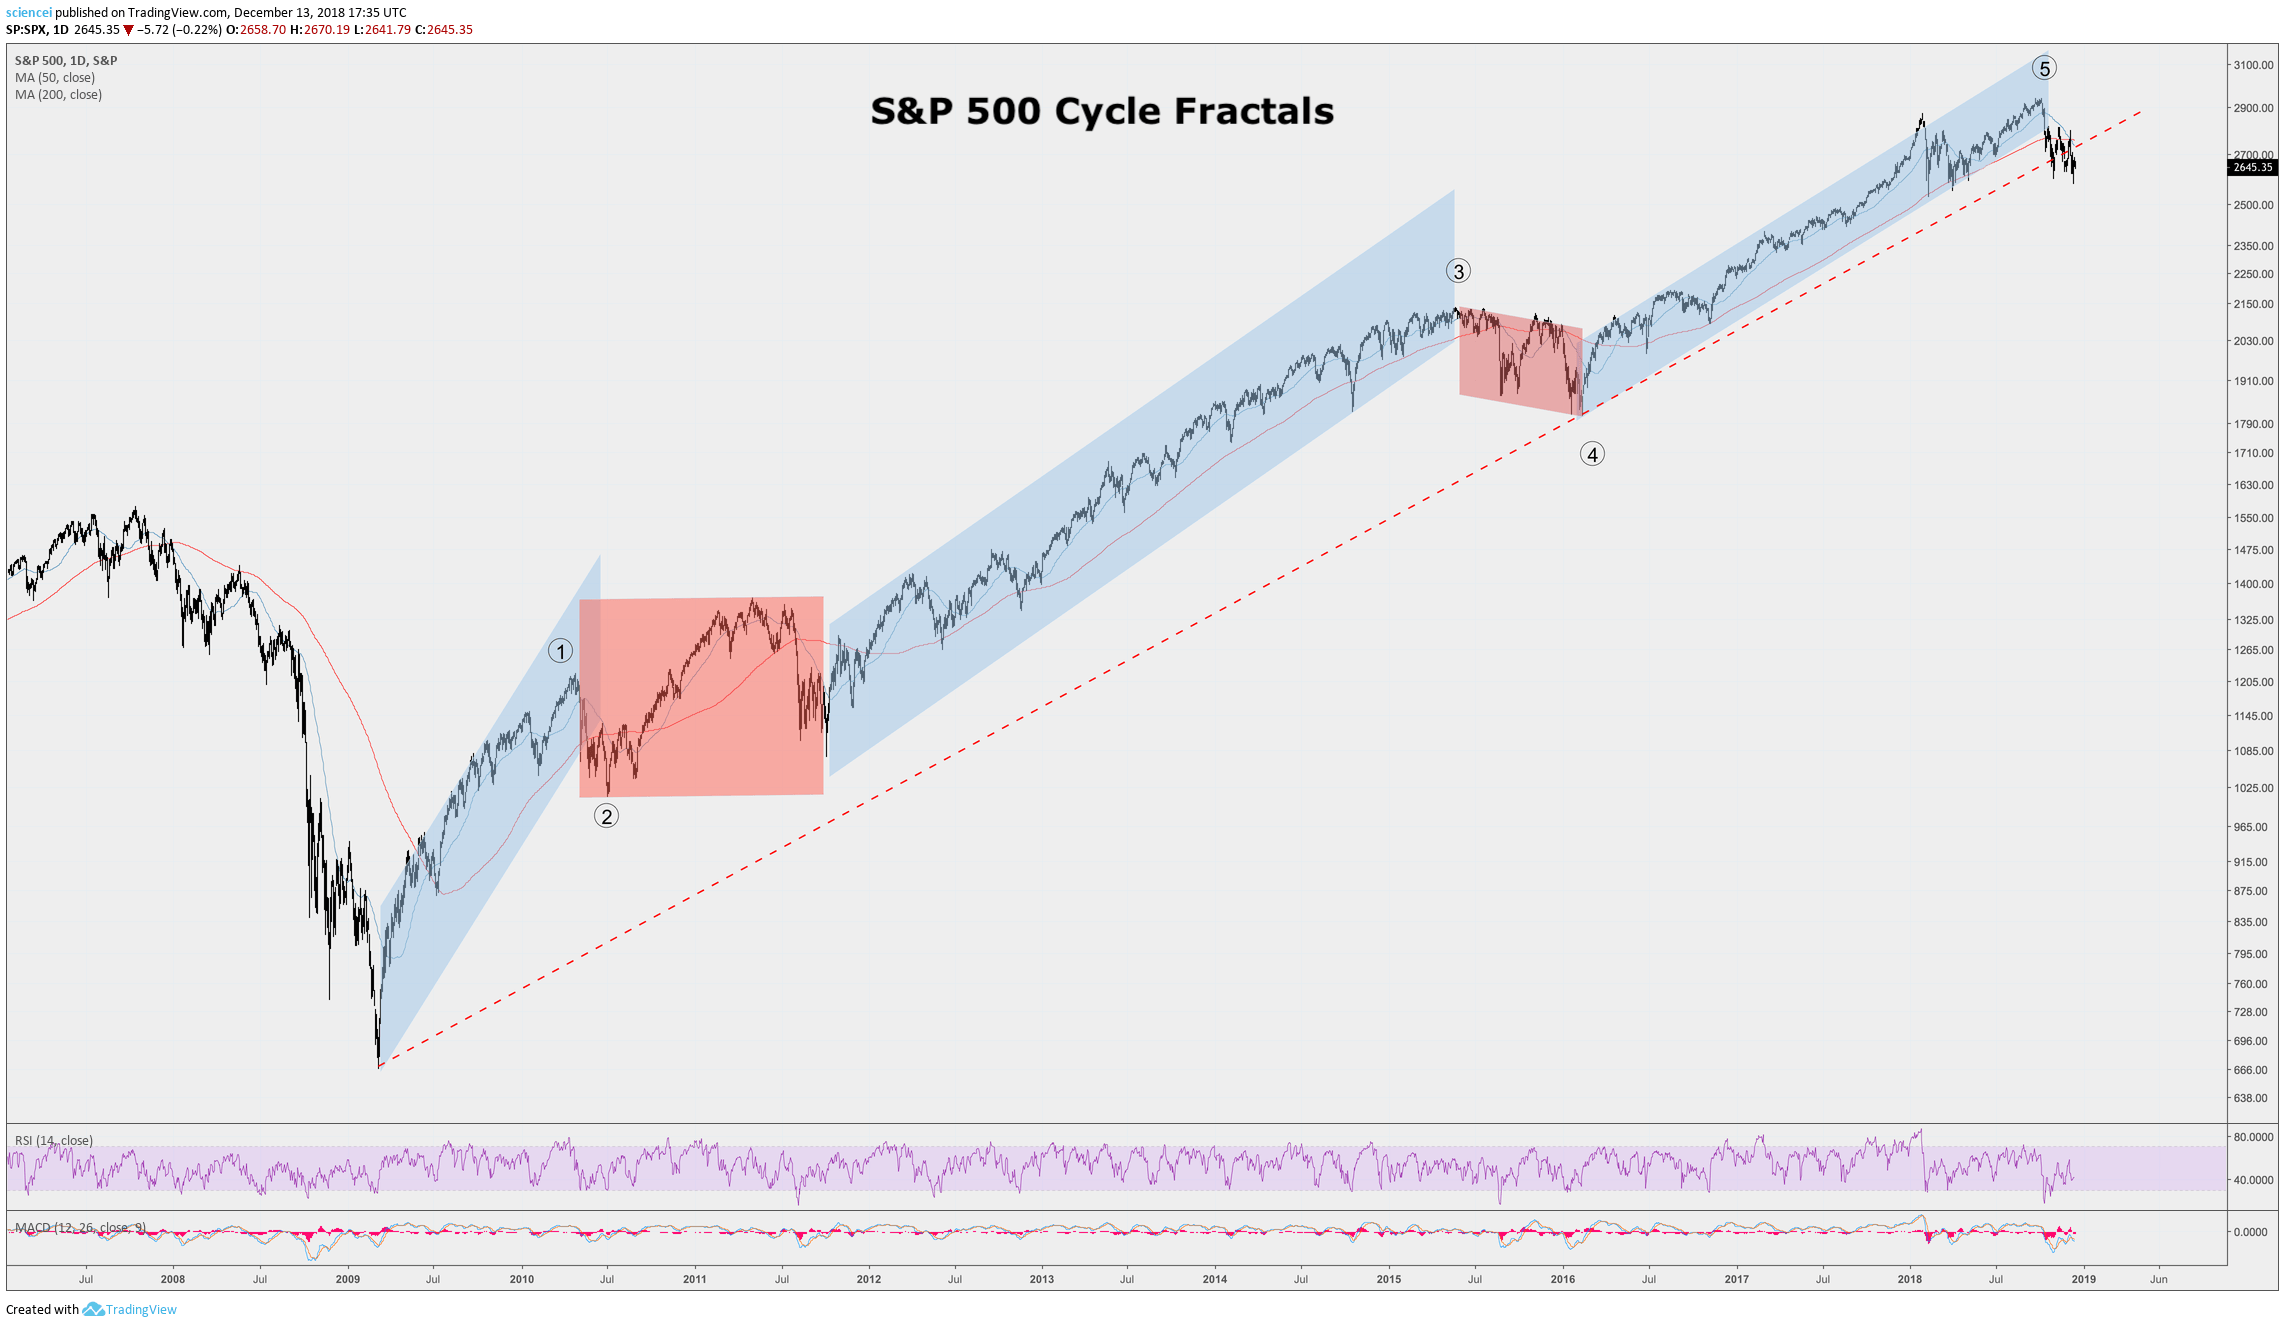
The latest technical evidence adds up in support of a cyclical turn. All major US equity indices trade below their 200-day moving average (200DMA abbreviated hereafter). This situation persisted for several weeks as we publish this write up. Such duration is unusual relative to the past cycle. The only instances that the 200DMA got crossed to the downside for several weeks are marked by the red corrections in the very first chart below. Apart from these two instances, none of the US equity indices rested for more than a couple of weeks below their 200DMA during the latest expansionary cycle. Both corrective periods coincide with 2nd and 4th Elliott waves. Another period matching the character of these corrective waves is beyond a complete Elliott Wave cycle. Hence, the technical pattern probably finished already and signals a cyclical turn. Moreover, the long-term trend, which is depicted by the dotted red line in the S&P 500 chart, got also broken on some of the major US indices lately. That is another strong signal for a cyclical turn during late 2018. All in all, the signals that the major US indices are sending us are alarming with regard to their timing. The market is probably in a very late stage of the cyclical expansion.
Additionally, Europe is probably stuck in a secular correction. A cyclical turn most likely occurred on the other side of the Atlantic during early 2018. The German DAX, representing Europe’s biggest economy, appears to be on its best way to confirm our bearish outlook. The index dropped by more than 20% from its 52-week high as of last week. Emerging markets dropped also sharply during 2018. Chinese equities are probably the most important market among them. The Shanghai Composite Index lost a quarter of its value since it peaked in early 2018. The bearish picture across risky assets got confirmed by crude oil lately. Historically, crude oil has been a late cycle performer. It corrected also severely during the past weeks, which often signaled a cyclical turn historically. All in all, this indicates cross-market evidence that risky assets across the globe entered a bear market. They diverged to each other during the past few months. All-time highs or recovery highs occurred months apart from each other. That’s a typical phenomenon around cyclical tops and bottoms. The months before the crises of 2000 and 2007 are good examples. Both periods recorded tops, which were months apart for the major equity indices worldwide.
US equities are most likely to get contaminated by the correction. They have been lagging during the topping process. The major US indices are showing early signs of a cyclical turn already. These appear during a very late stage of the expansionary cycle. All in all, the technical macro picture suggests a cyclical turn for US equities. The past two cyclical corrections erased roughly half of the broad-based index valuations. US equity returns will probably disappoint during the next couple of years.
Interested in more of our ideas? Check out Scienceinvesting for more details!
Interested in more of our ideas? Check out Scienceinvesting for more details!
Author

Science Investing Team
Science Investing


