S&P 500: Our target for year end

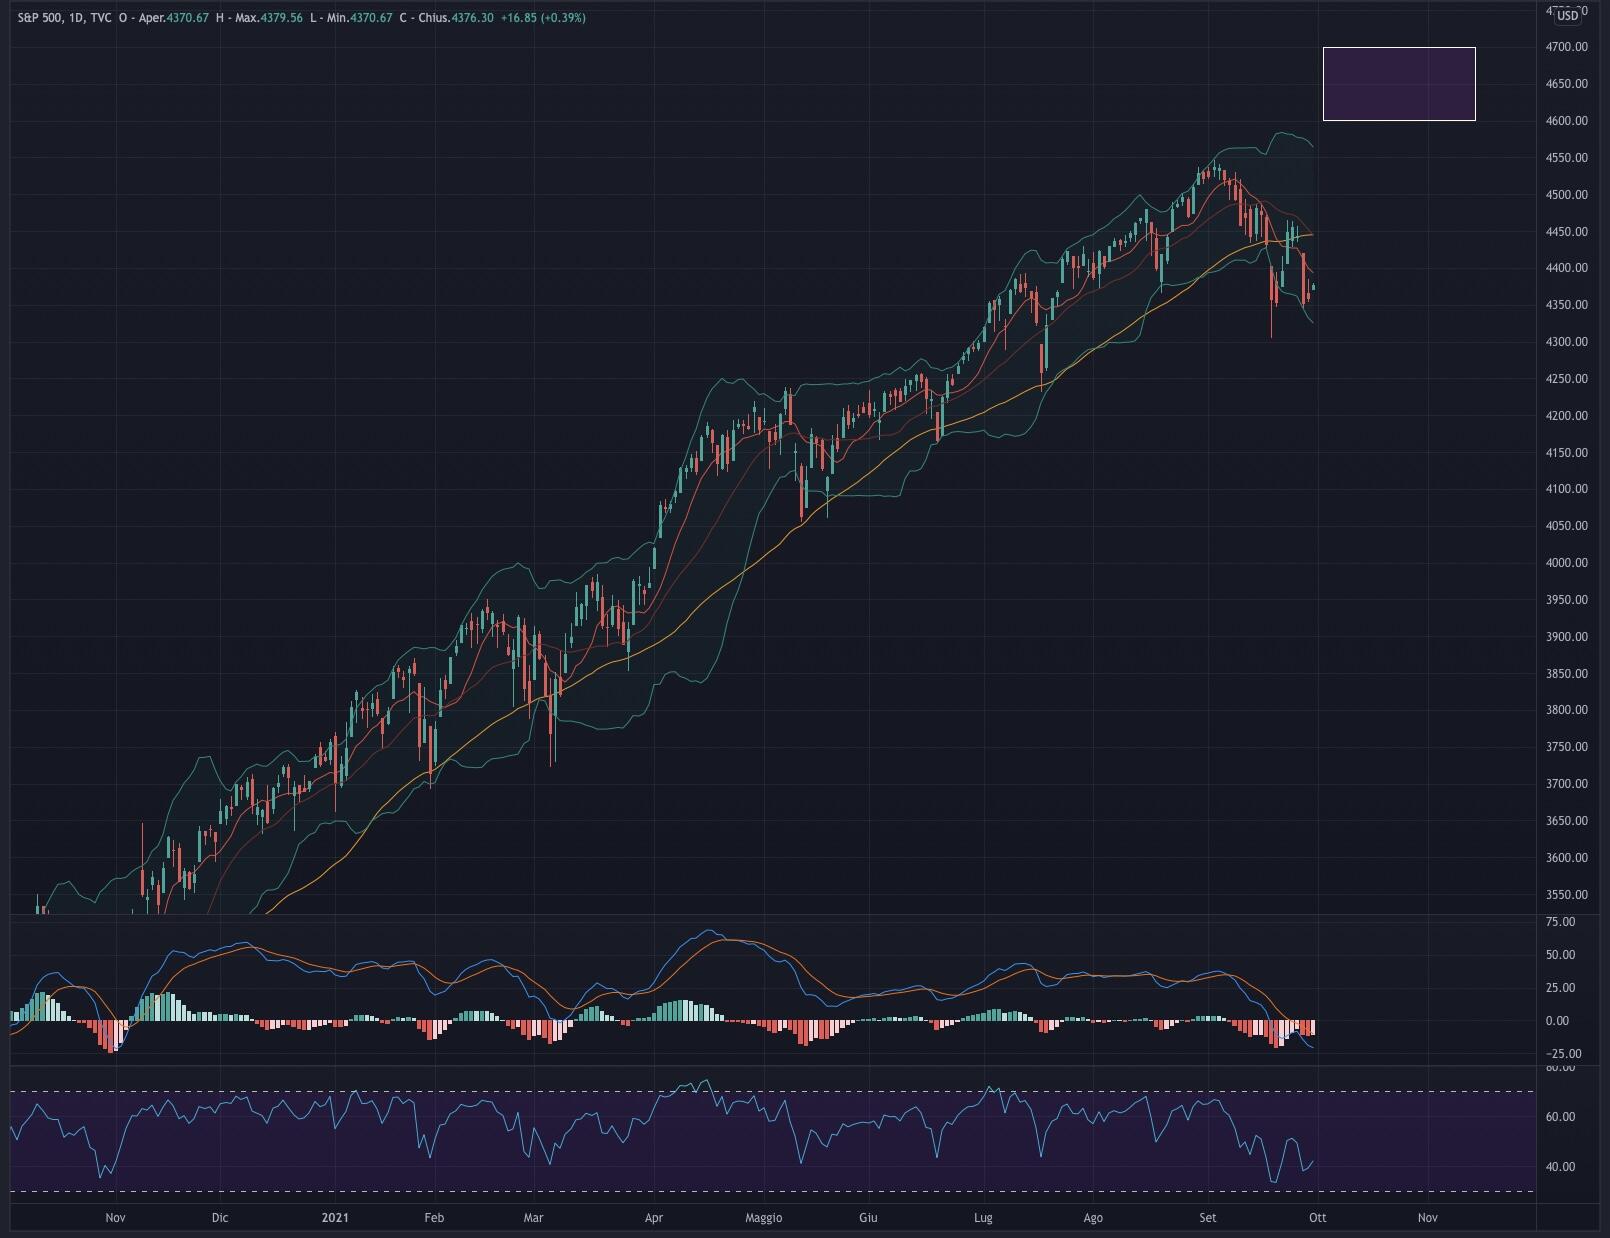
The S&P 500 index, after a strongly bullish summer, found in September not a few difficulties in continuing at a sustained pace and above all on the rise: in fact the decline suffered in this last month touched -5.11% on the day of September 20, 2021 .
Combining the seasonality of the index combined with the S5FI indicator (S & P500 stocks above 50-day average) we realize that not only the downward swings in September have followed a regular trend with the seasonality of the index but that the basis for a recovery in the final part of the year that reflects our target of 4,600-4,700.
Seasonality S&P 500
The chart takes into account the performance of the SPY ETF (reference ETF for the S & P 500) over the past 20 years. This goes to highlight how the months of September, June and January are "historically" months of suffering for the American index and then regain ground in the final 3 months.
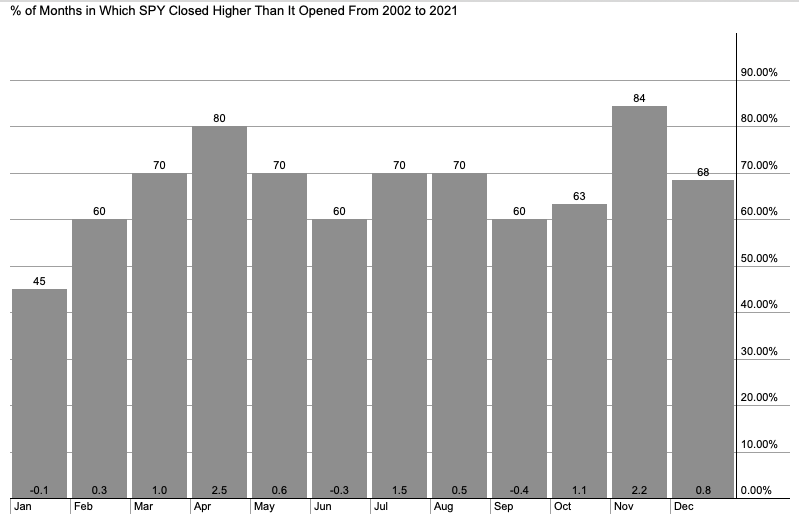
According to the graph, we note that 60% of the time the SPY closed the month of September down compared to August with an average loss of % of months in which SPY closed higher than the previous month between 2002 and 2021 -0.4%.
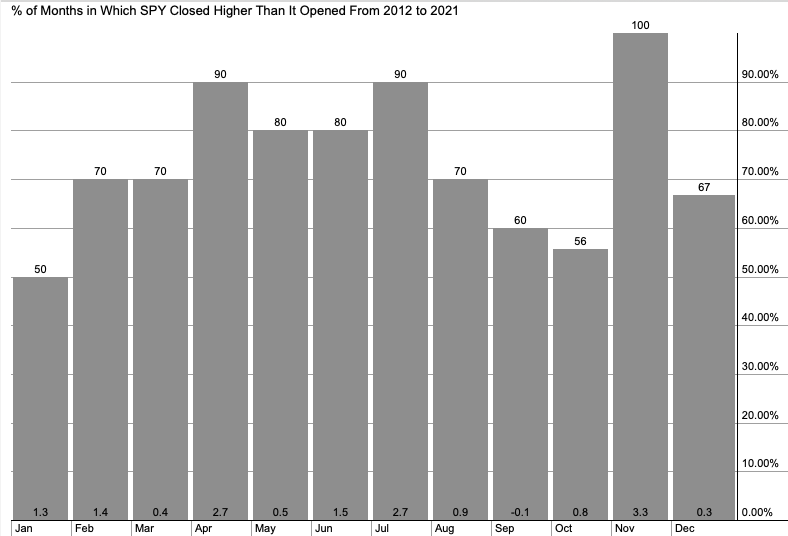
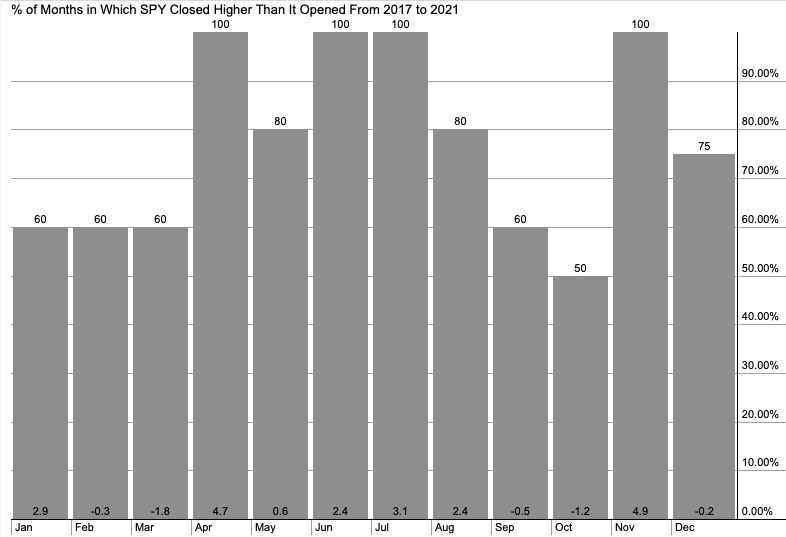
In case we wanted to tighten the field further by focusing on the last 10 and 5 years, we note that the general scenario does not change: in both cases, 60% of the time the SPY closed down in September with an average loss that oscillates between -0.1% and -0.5%.
The most important aspect to underline is that in the last 10 and 5 years, the bearish fluctuations have also extended to October in 50-56% of cases.
From the seasonality of the S & P 500 we can therefore understand:
-
The bearish swings in September reflect a regular seasonality.
-
October could be a month of consolidation and then start up again
To refine our theory, we use a second indicator: S&P 500 stocks above 50-day average.
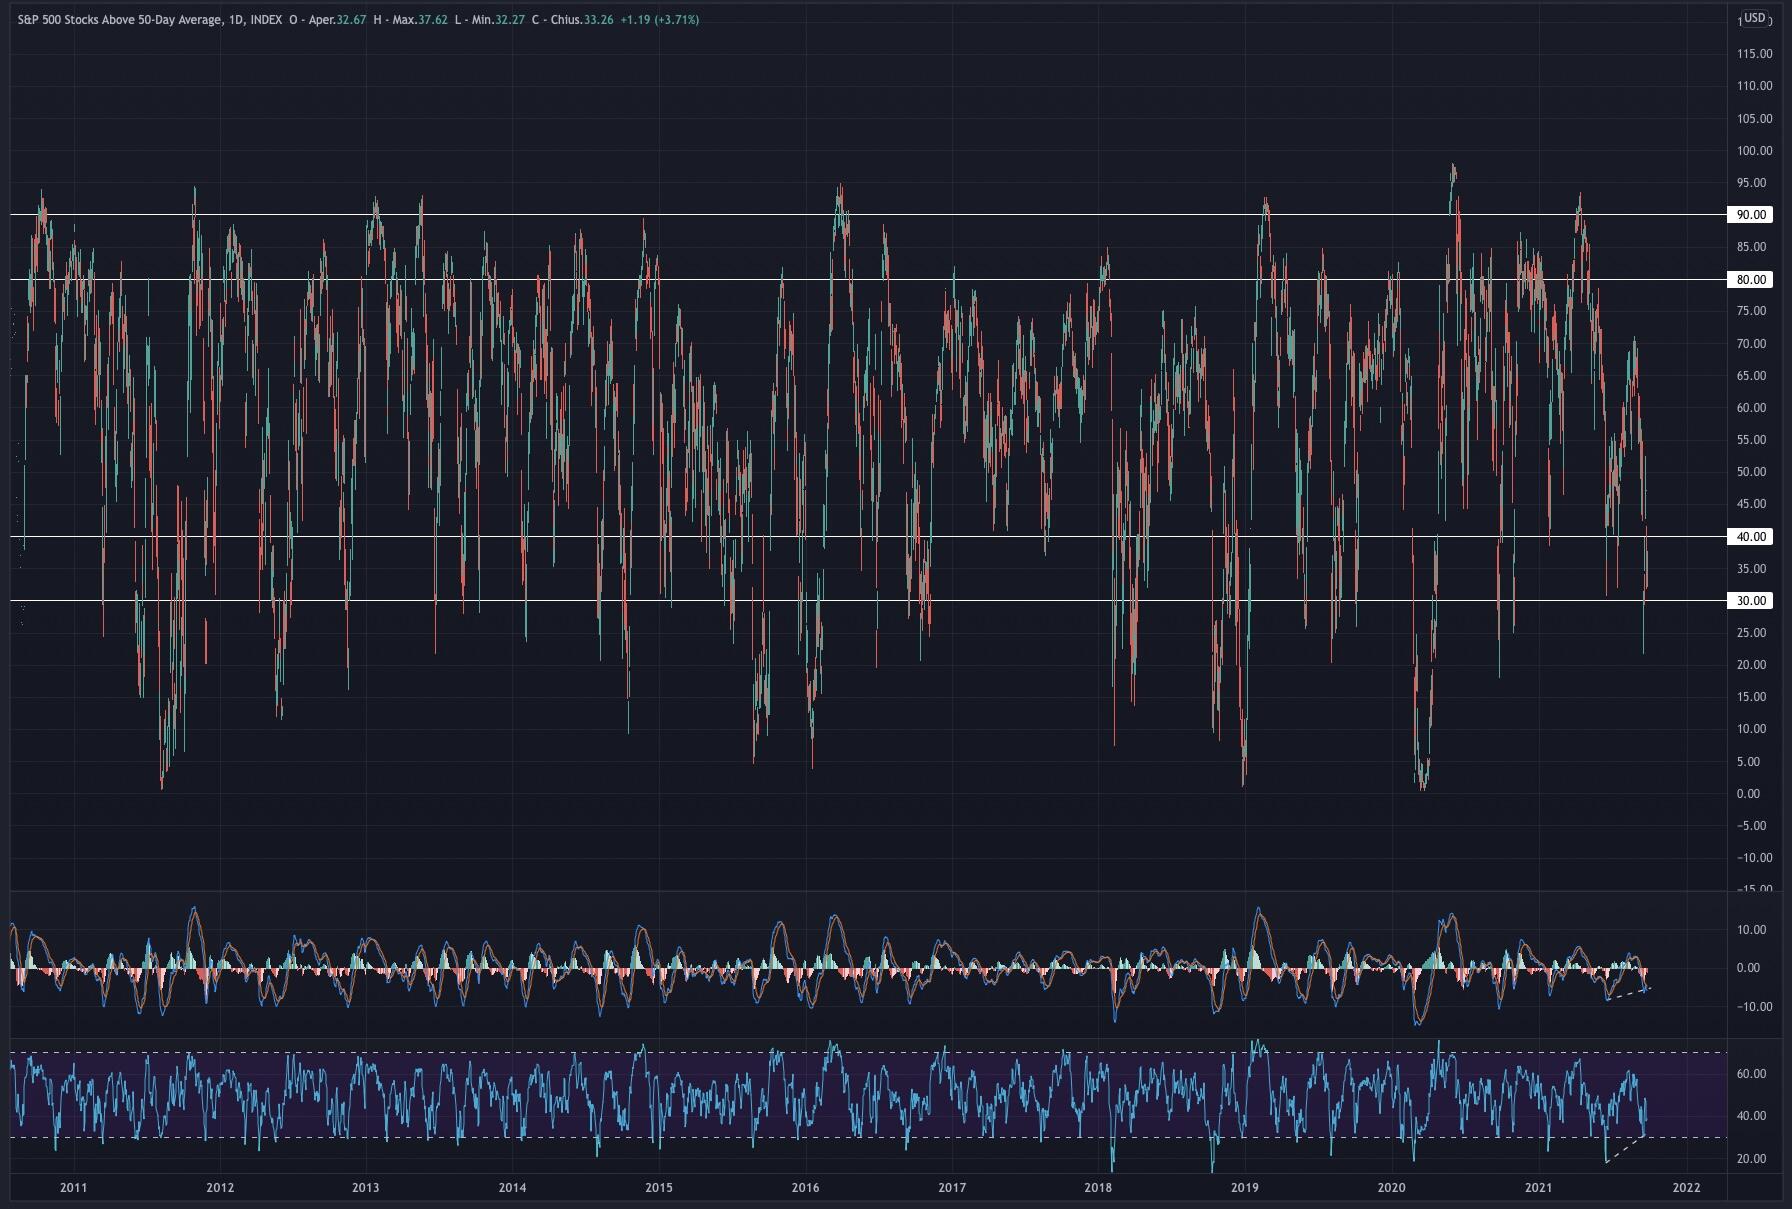
S&P 500 stocks above 50-day average
As the name of the graph explains, we see depicted the percentage of stocks in the S & P500 that are above the 50-day average: as in the previous graphs, we note how in the months of September, June and January the percentage of stocks below below the 50-day average it reaches levels below 50%.
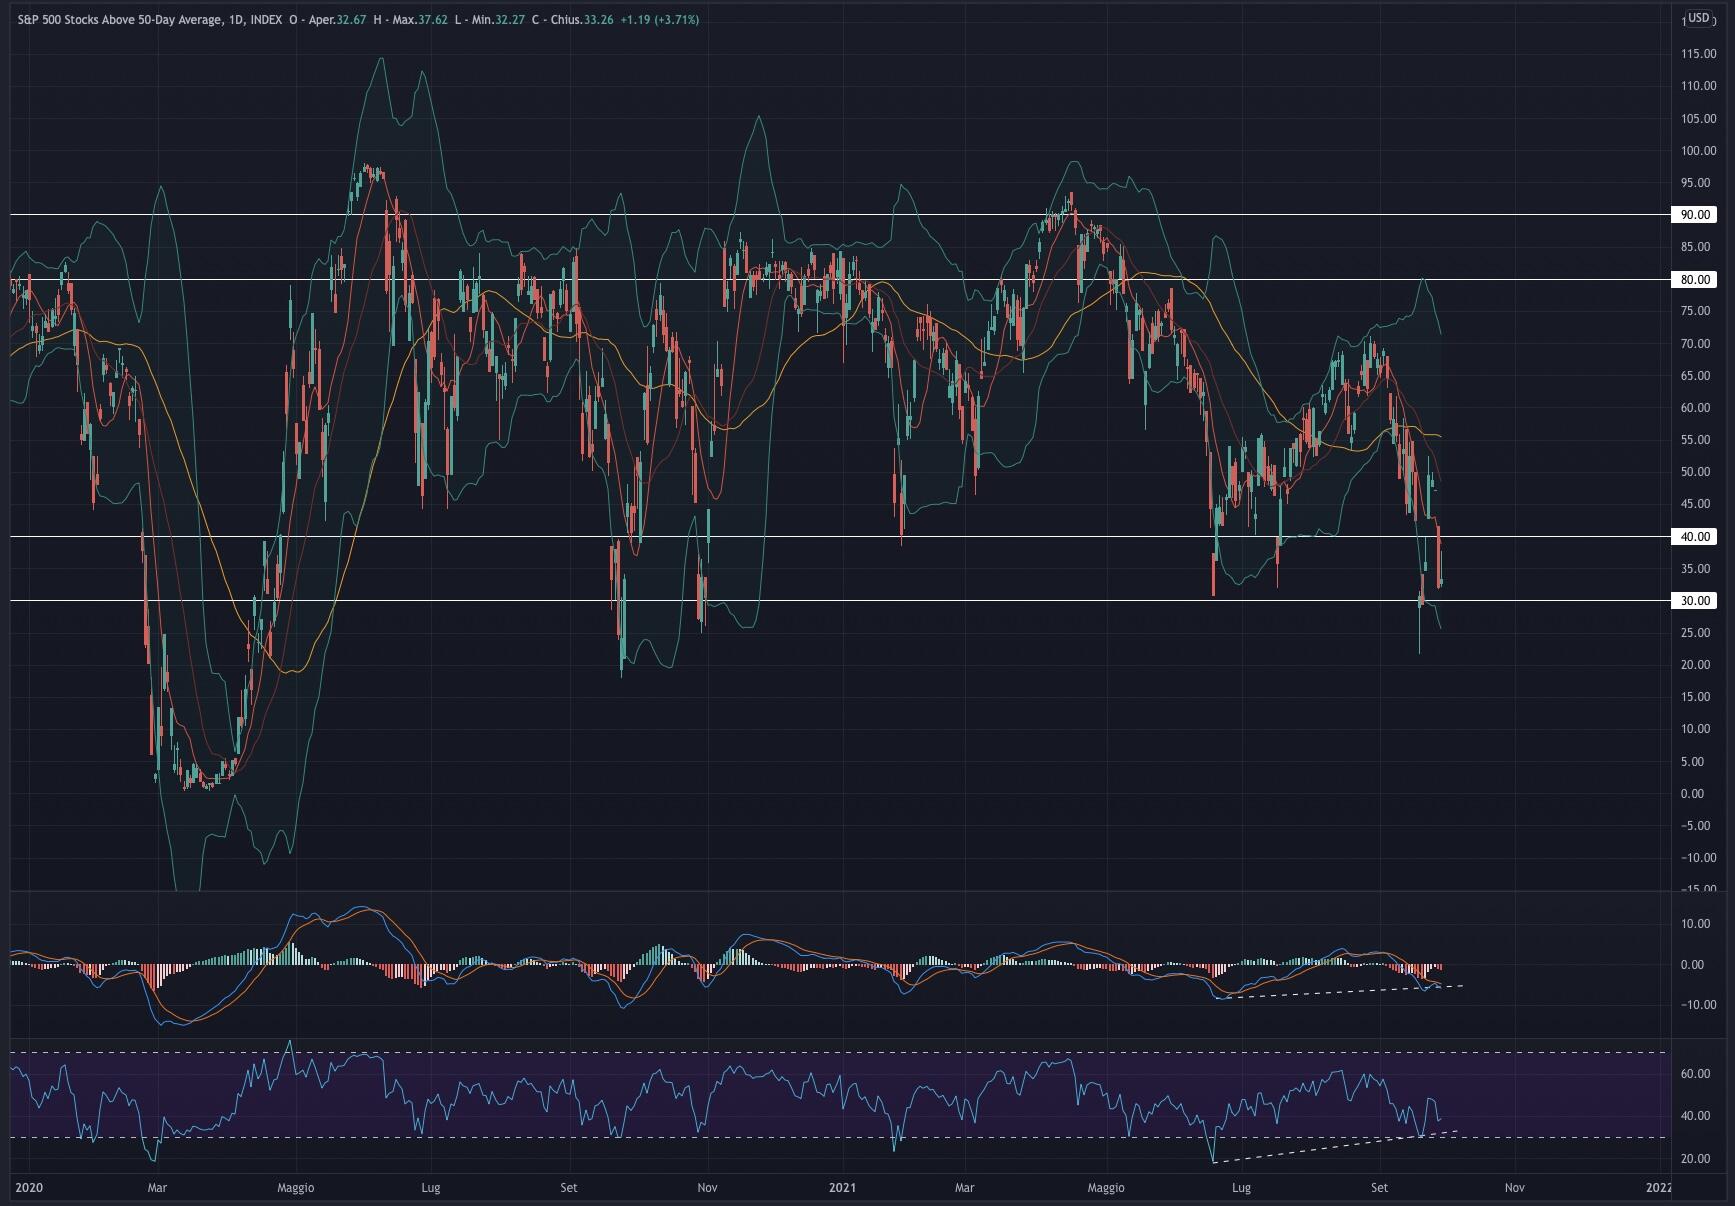
If we analyze the daily chart, we see a strong support area between 30% -40% and a strong resistance area at 80% -90% which has been substantially respected in the last 10 years, except for rapid bearish extensions recovered in a time frame of less than 2 months and which have always seen the month of September - October as bottoming for a subsequent bullish recovery.
From a technical analysis point of view, in addition to the support and resistance areas, we can also note a positive divergence between the lows recorded by the MACD and RSI indicators with the lows reported by the chart in the period June - September 2021. These divergences tend to foretell bullish fluctuations not visible from an analysis exclusively made on the price.
From the chart on the% of stocks above the 50-day average we understand that:
The indicator is currently on a strong support level that has played the basic role for bullish swings several times
The MACD and RSI internal oscillators are in positive divergence with the price, which could herald a bullish recovery in the coming months
Conclusions
We believe that the recent bearish swings that have led the S&P 500 to retrace by 5% are offering an excellent entry point to benefit from upside in the coming months.
Recovery that we expect to take place in October after a phase of consolidation.
We expect a recovery from the previous highs of 4,550 in November with a possible push between 4,600-4,700 by the end of the year benefiting from the “holy rally” phenomenon.
Our conclusions are supported both by the seasonality of the S & P 500, which remained so throughout most of 2021, and by the chart of the% of stocks above the 50-day average, now on a strong support area.
Author

Francesco Bergamini
OTB Global Investments
Francesco, BSc Finance and Msc in Business Management, graduated with Merit, is a professional with experience in the financial services industry and a keen interest in the financial markets.


