S&P 500: Five charts to explain the comeback and why coronavirus carnage may crash it again
- The S&P has risen over 30% within a month, erasing more than half its losses.
- The move comes despite growing evidence of severe economic damage.
- Five charts explain the reasons are behind the move.
- Each reason for the rise has the potential to turn sour.

The S&P 500 stock index is up over 30% from the lows, staging an impressive recovery. The rise comes as over 26 million Americans lost their jobs, and more will come at a rapid pace. Retail sales plunged by over 8% in March – despite frantic shopping for groceries – and forward-looking service sector surveys fell to record lows. Coronavirus and the lockdowns are taking a heavy toll on the economy.
What is going on? The following five charts explain the move and why S&P 500 may tumble down.
1) Fed fueling the rally (reached its limits?)
Perhaps the most significant upside driver has been abundant monetary stimulus, especially in the form of Quantitative Easing – money printing. The Federal Reserve's balance sheet has surpassed the $6.5 trillion mark, up from just over $4 trillion before the crisis hit.
The post-crisis peak stood at roughly $4.5 trillion after several rounds of QE that lasted years. Some of the $2.5 trillion of new money created within six weeks spilled into equity markets and certainly helped boost sentiment.
The Fed has thrown the kitchen sink, buying debt of "fallen angels" – junk bonds – and also expanded its purchase of municipal debt. It may have reached its limits, and without a further supply of Fed funds, shares may turn south.
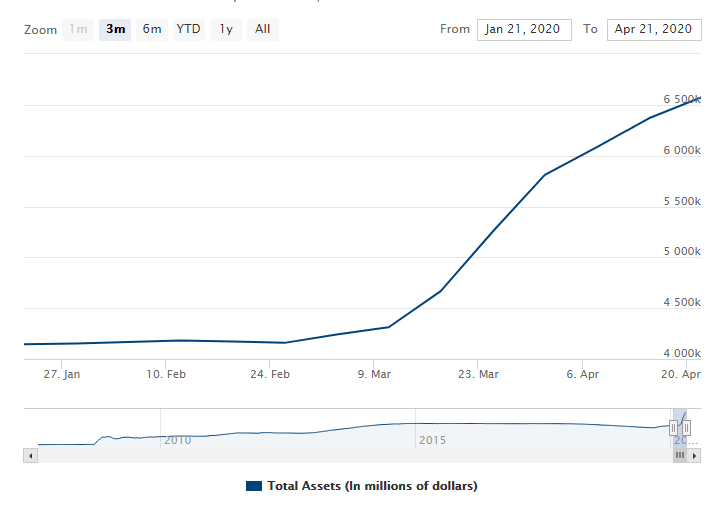
Source: Federal Reserve
2) Massive focal stimulus (but there is bailout fatigue)
The government has also been active in supplying fiscal stimulus, pumping money into the economy. Apart from helping consumers and businesses, the funds also support the stock market. While the US has not pledged as many funds – compared to its Gross Domestic Product – the majority of cash deployed is in direct payments. That differs from other countries that opted for deferrals and loans.
However, after several rounds of bipartisan agreements, cracks are opening. Lawmakers and the public still have the 2008-2009 crisis in mind, where sometimes unworthy companies were bailed out. Disagreements over help to states and the oil industry are already showing. The US economy is reeling and probably needs more support for small businesses and individuals who lost their jobs and the accompanying health insurance.
Without imminent new stimulus in the face of a worsening economic situation, investors may shy away. The government may always directly buy stocks, but that remains a remote option.

Source: Bruegel, via Statistica
3) Fear was exaggerated (but also the current greed)
What goes up, must come down, and the other way around. The S&P 500 lost around a third of its value within less than a month and then gained nearly the same amount in percentage terms, which is insufficient to reconquer the highs.
Fear from coronavirus carnage may have been exaggerated, but also greed in light of fiscal and monetary stimulus may have gone too far. Markets tend to overreact in both directions. As the dust settles and the depth of the damage is realized, the pendulum may swing lower. Perhaps it will be without the fanfare of the previous crash, but it is hard to defy gravity in the face of the grave situation.
-637237475265106170.png)
4) Stronger stocks are carrying the weak (for now)
The S&P 500 is comprised of 500 shares, not all of the equal size. At the time Goldman Sachs performed the research, the S&P 500 was 17% below its record high in February, but the media stock traded some 28% off the peak. That means that a small number of shares – such as Amazon, which is having a good crisis – are carrying the weight.
Such disparities have been seen in the past, but eventually resulted in sharp downturns. As researchers from the bank state on the graph, these shape declines in market breadth have often signaled severe recessions. The momentum may reverse sooner than later, and stronger stocks may be carried down the majority of weaker ones.
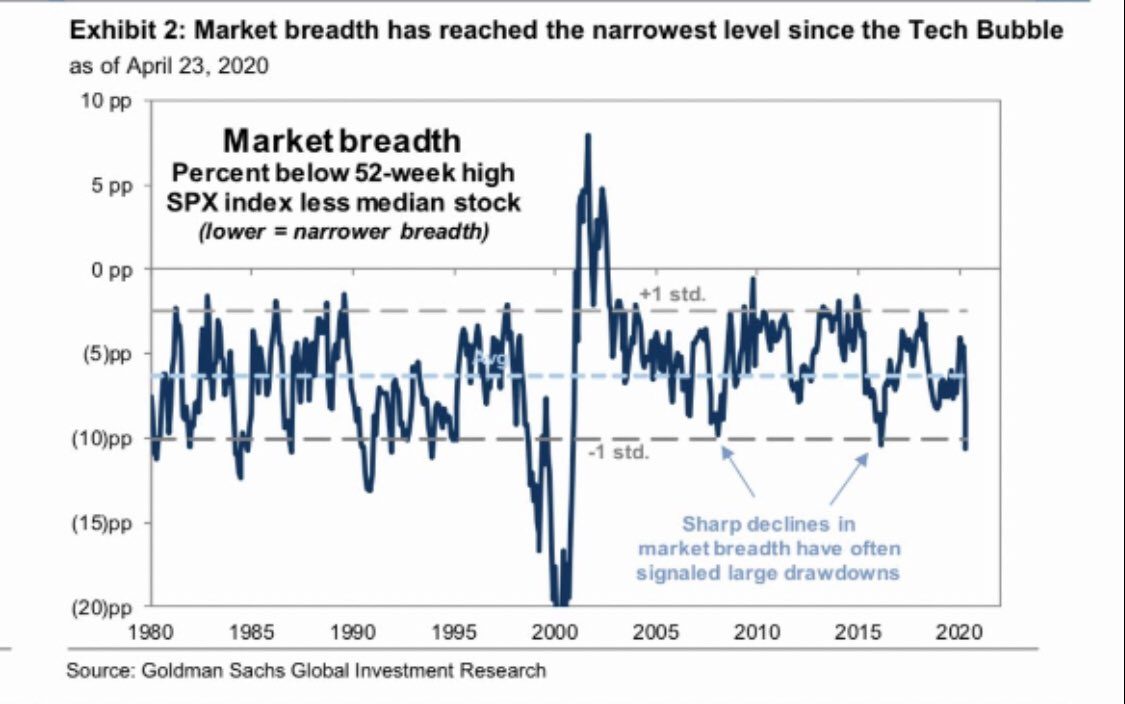
Source: Gold Sachs. Hat tip, Jonathan Ferro, via Twitter.
5) Some hope (but beware of a second wave
The US has succeeded in flattening the curve with the absolute number of total deaths falling to an average pace of under 2,000 per day. The logarithmic chart below shows how the world's largest economy managed to slow the spread, and a gradual lifting of restrictions is warranted. That also provides hope for equity bulls.
Experts recommend easing stay-at-home orders with means to contain new cases – testing and contact tracing quickly. With rapid probes, people carrying the virus and those they may have infected can be rapidly isolated and prevent a further spread.
However, the US is far from reaching the recommended level of daily tests or hire enough people to trace contacts. Moreover, pressure from President Donald Trump may push some governors to move too quickly. Germany, where testing has been lauded worldwide, the easing of lockdown measures raised the infection rate, and the government is considering reimposing restrictions.
A second shelter-in-place order is far worse than extending existing limits to movement as it may deal a blow to consumer and business confidence.
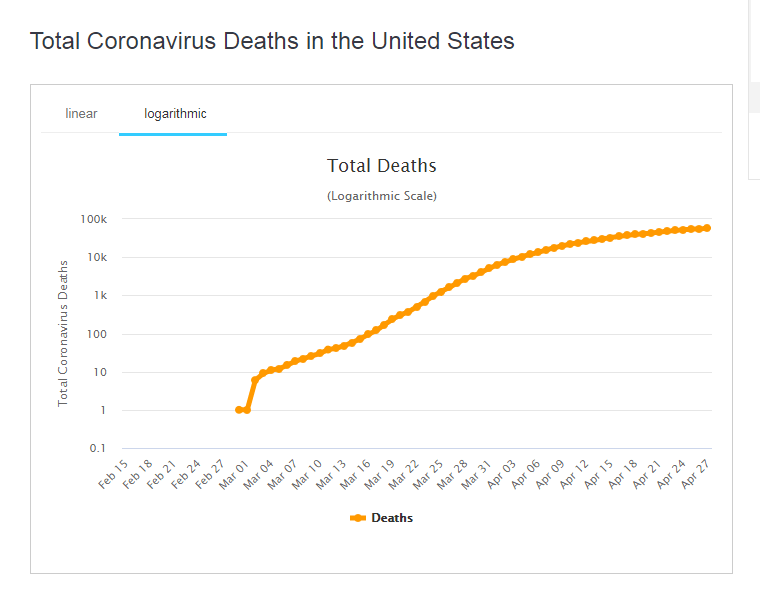
Source: WorldInfoMeter
Conclusion
Five factors are boosting S&P to a remarkable rally from the lows, but all may prove ephemeral, and stocks may turn back down.
More: Lack of leadership may lead to L-shaped economy, markets may suffer badly
Author

Yohay Elam
FXStreet
Yohay is in Forex since 2008 when he founded Forex Crunch, a blog crafted in his free time that turned into a fully-fledged currency website later sold to Finixio.


