S&P 500 charts lower peak

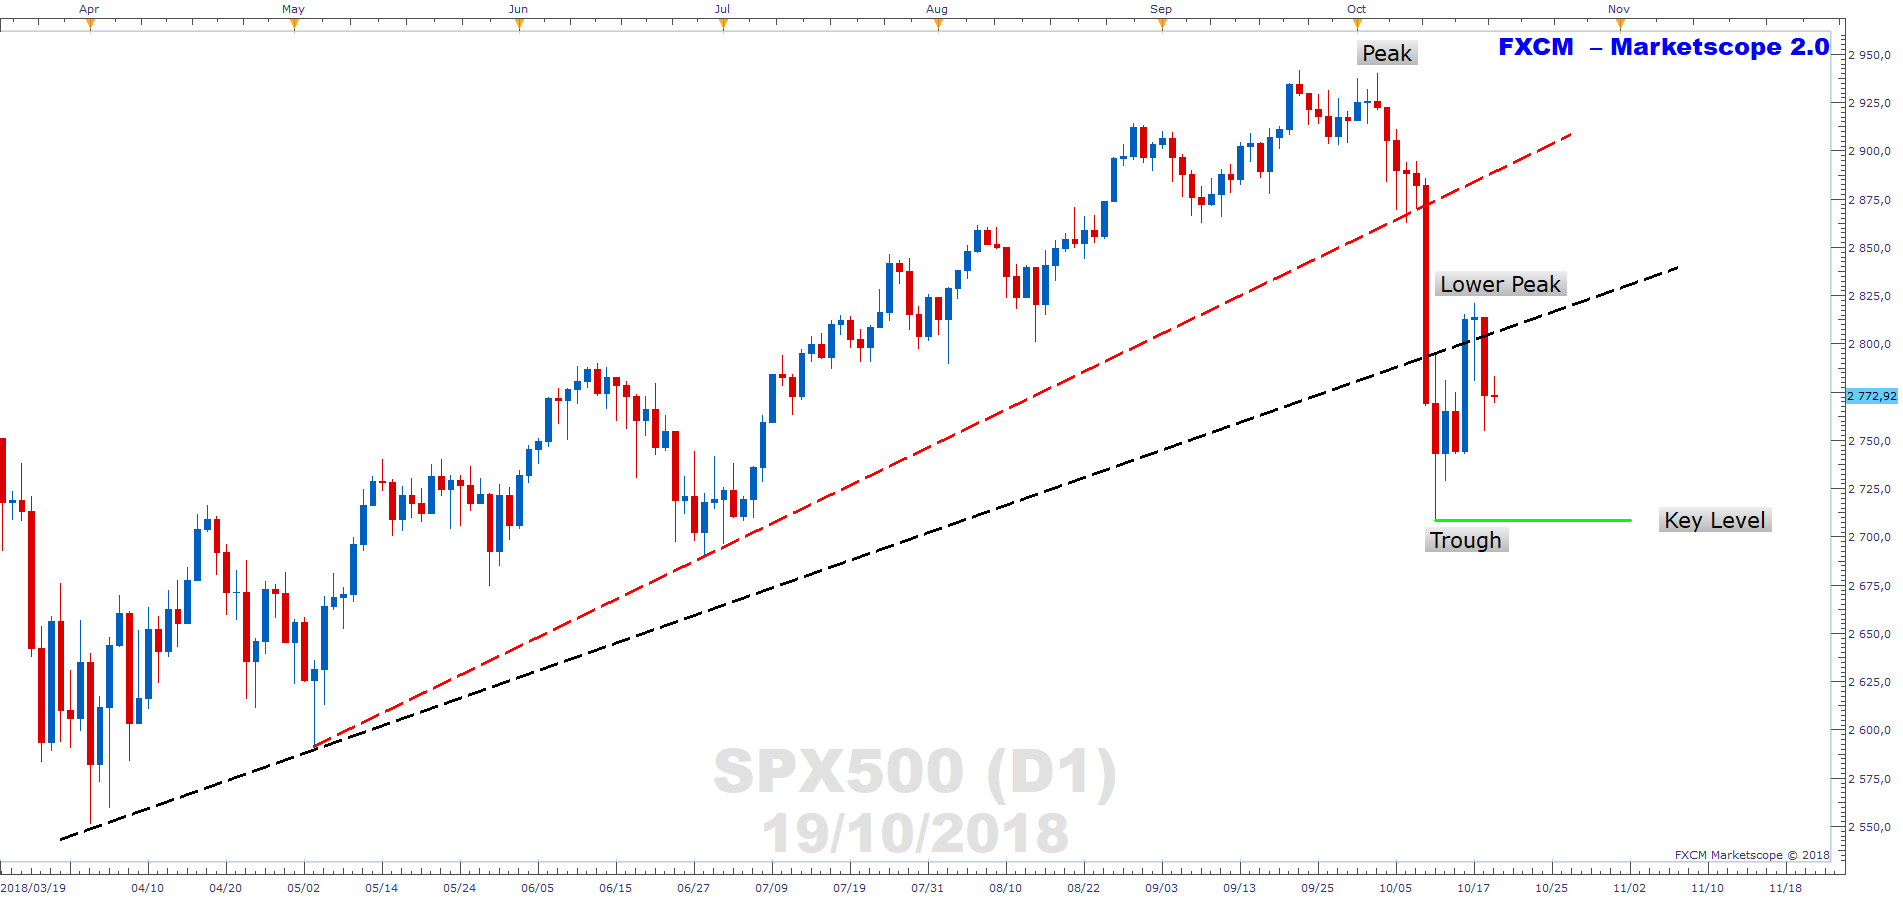
The above chart shows daily price action. The SPX500 charted a lower peak yesterday. That puts the index into a position of weakness. A break below the green horizontal will be potentially important. This will result in a lower peak followed by a lower trough, which is the classical definition of a downtrend. If this happens capital is likely to flow from the risk-on assets to the havens.
Author

Russell Shor (MSTA, CFTe, MFTA) has an Honours Degree in Economics from the University of South Africa and holds the coveted Certified Financial Technician and Master of Financial Technical Analysis qualifications from the Interna
More from Russell Shor, CFTe, MFTA


