S&P 500 at New Medium-Term High, but Correction May Be Coming

Stocks extended their short-term uptrend on Friday, as investors' sentiment remained bullish following the monthly jobs data release. The S&P 500 index got closer to its last year's September record high. But will the uptrend continue despite some technical overbought conditions?
The U.S. stock market indexesgained 0.2-0.6% on Friday, extending their uptrend, as investors sentiment remained bullish. The S&P 500 index retraced more of its October-December downward correction of 20.2%. The broad stock market's gauge is nowjust 1.6% below September the 21st record high of 2,940.91. The Dow Jones Industrial Averagegained 0.2% and the Nasdaq Composite gained 0.6% on Friday.
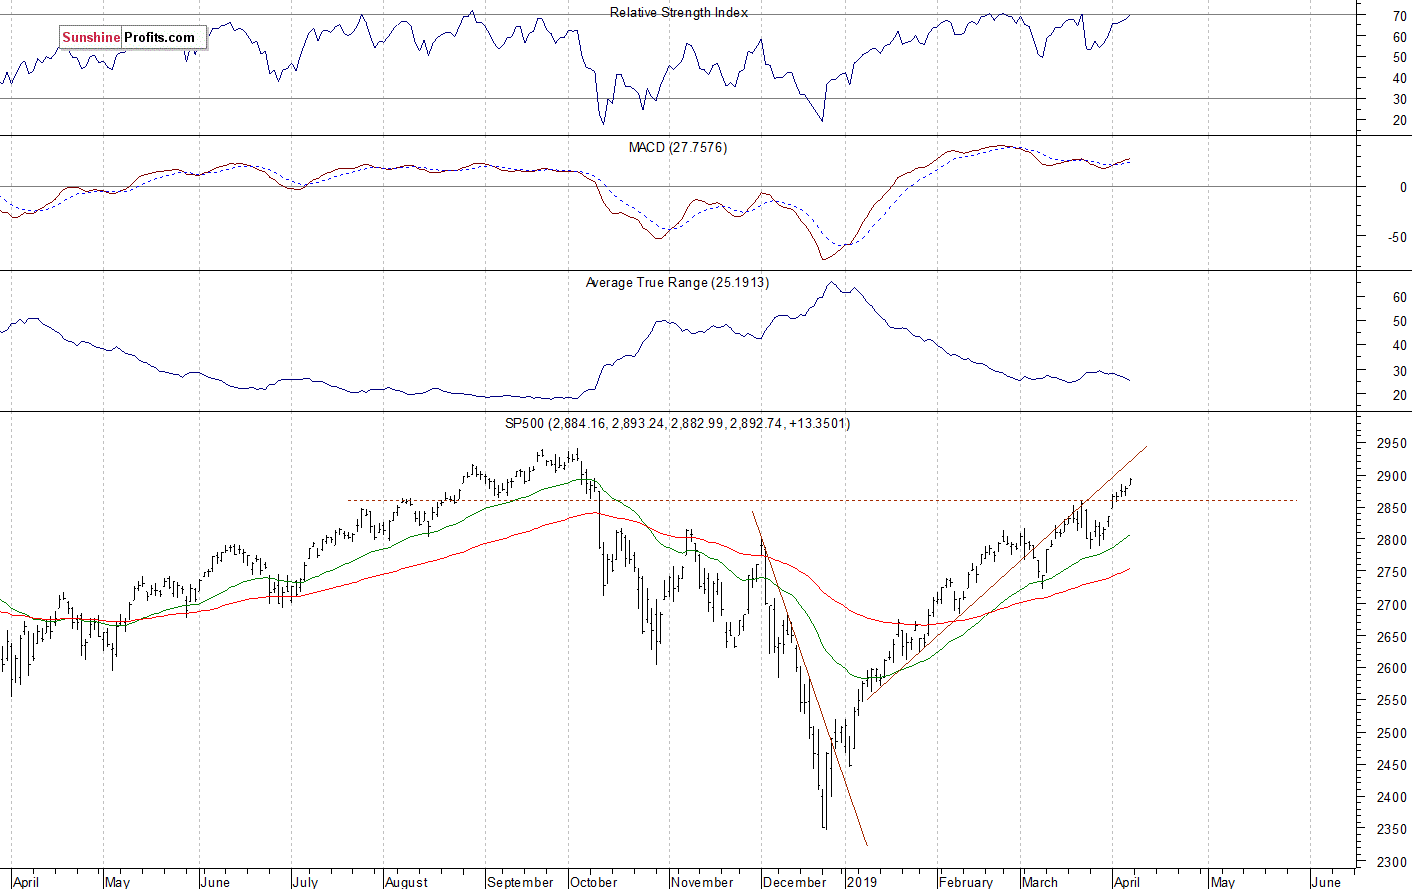
The nearest important resistance level of the S&P 500 index remains at 2,890-2,900, marked by some early October local highs. The next resistance level is at 2,920-2,940, marked by the mentioned record high, among others. On the other hand, the support level is now at 2,880-2,885, marked by Friday’s daily gap up of 2,881.28-2,882.99. The support level is also at 2,860-2,865, marked by the recent local lows.
The broad stock market retraced all of its December sell-off and it broke above the medium-term resistance level of around 2,800-2,820, marked by the October-November local highs recently. So is it still just a correction or a new medium-term uptrend? We may see an attempt at getting back to the record high. There have been no confirmed negative medium-termsignals so far. The index gets closer to its last October all-time high, as we can see on the daily chart:
Slightly Negative Expectations
Expectations before the opening of today's trading session are slightly negative, because the index futures contracts trade 0.1-0.2% below their Friday’s closing prices. The European stock market indexes have been mixed so far. Investors will wait for the Factory Orders number release at 10:00 a.m. The broad stock market will likely fluctuate following the recent rally. We may see aprofit-taking action at some point.However, there have been no confirmed negative signals so far.
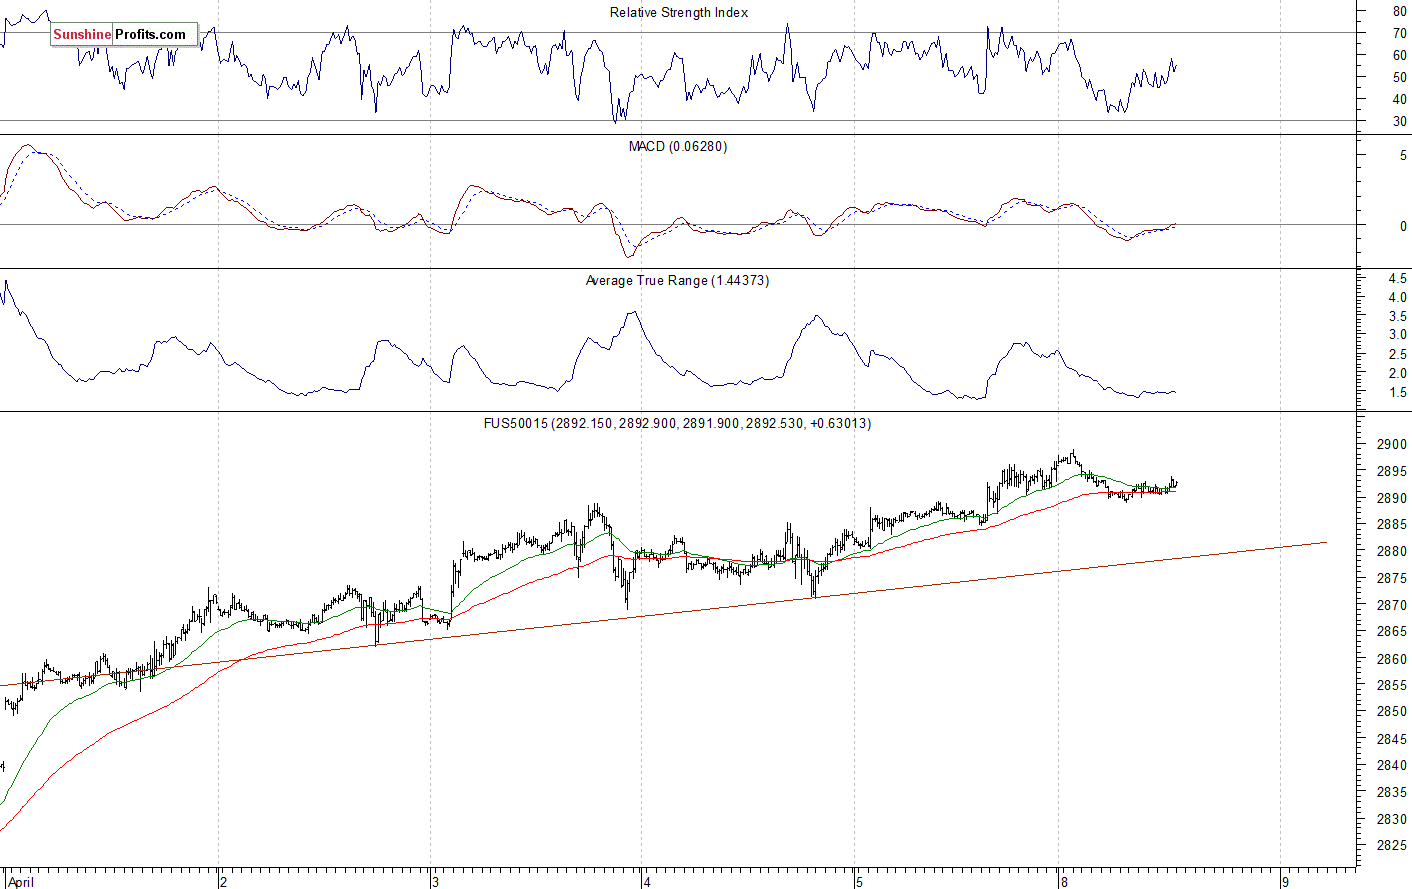
The S&P 500 futures contract trades within an intraday consolidation following an overnight decline. The nearest importantresistance level is at around 2,895-2,900. On the other hand, the support level is at 2,880-2,885, marked by the recent resistance level.The futures contract remains above its short-term upward trend line, as we can see on the 15-minute chart:
Nasdaq Close to 7,600 Mark
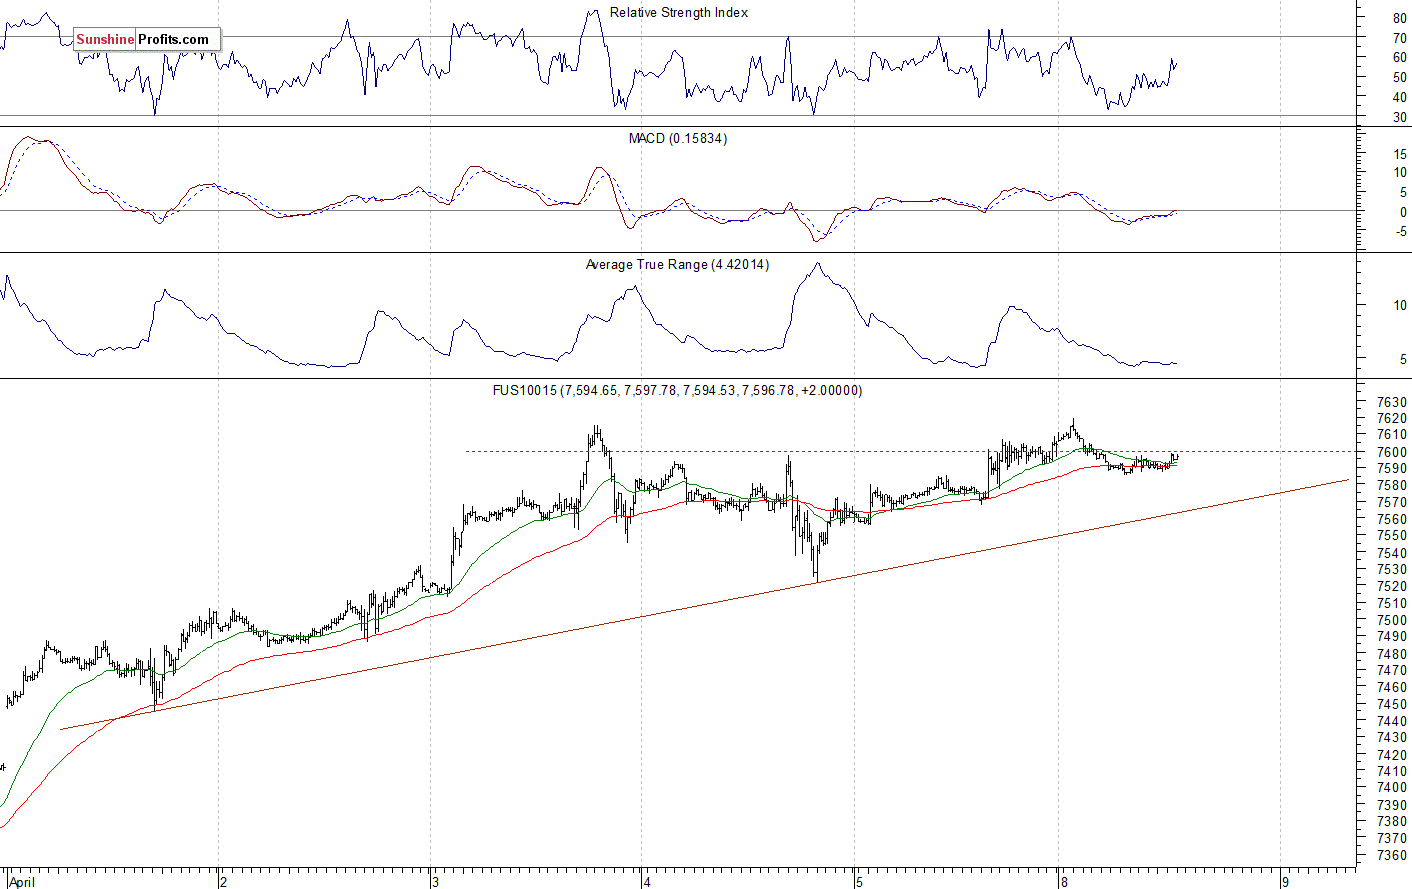
The technology Nasdaq 100 futures contract follows a similar path, as it trades within an intraday consolidation. The market slightly extended its medium-term uptrend on Friday and it broke above the 7,600 level again. It has retraced most of the late last year’s sell-off. The nearest important resistance level is at 7,600-7,650. On the other hand, the support level is now at 7,500-7,550. The Nasdaq futures contracttrades along the 7,600 level this morning, as the 15-minute chart shows:
Big Cap Tech Stocks Remain Close to Their Local Highs
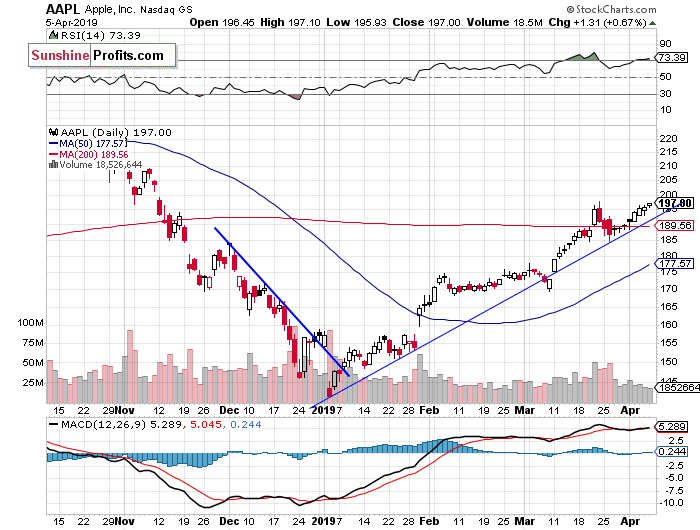
Let's take a look at the Apple, Inc. stock (AAPL) daily chart (chart courtesy of http://stockcharts.com). The stock accelerated the uptrend and it tradeswithin a resistance level of $190-200.The market continues to trade along the medium-term upward trend line:
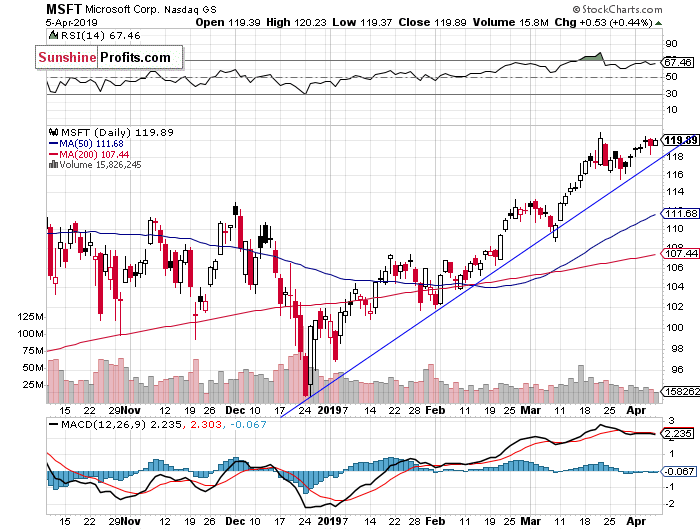
Now let's take a look at the daily chart of Microsoft Corp. (MSFT). The price continues to trade along the new record high. The resistance level is at around $120. The market remains above its three-month-long upward trend line:
Dow Jones Higher
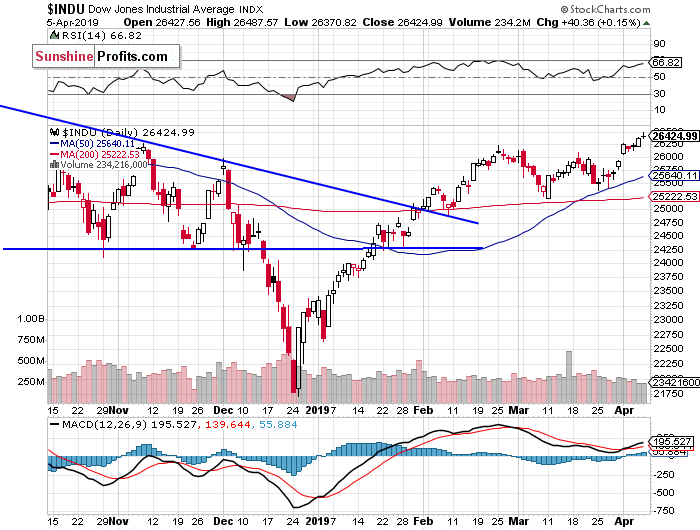
The Dow Jones Industrial Average broke above its February local highlast week and it resumedthe medium-term uptrend. The next resistance level is at around 26,800-27,000, marked by the last year’s topping pattern and the record high of 26,951.8:
Nikkei Still Going Sideways
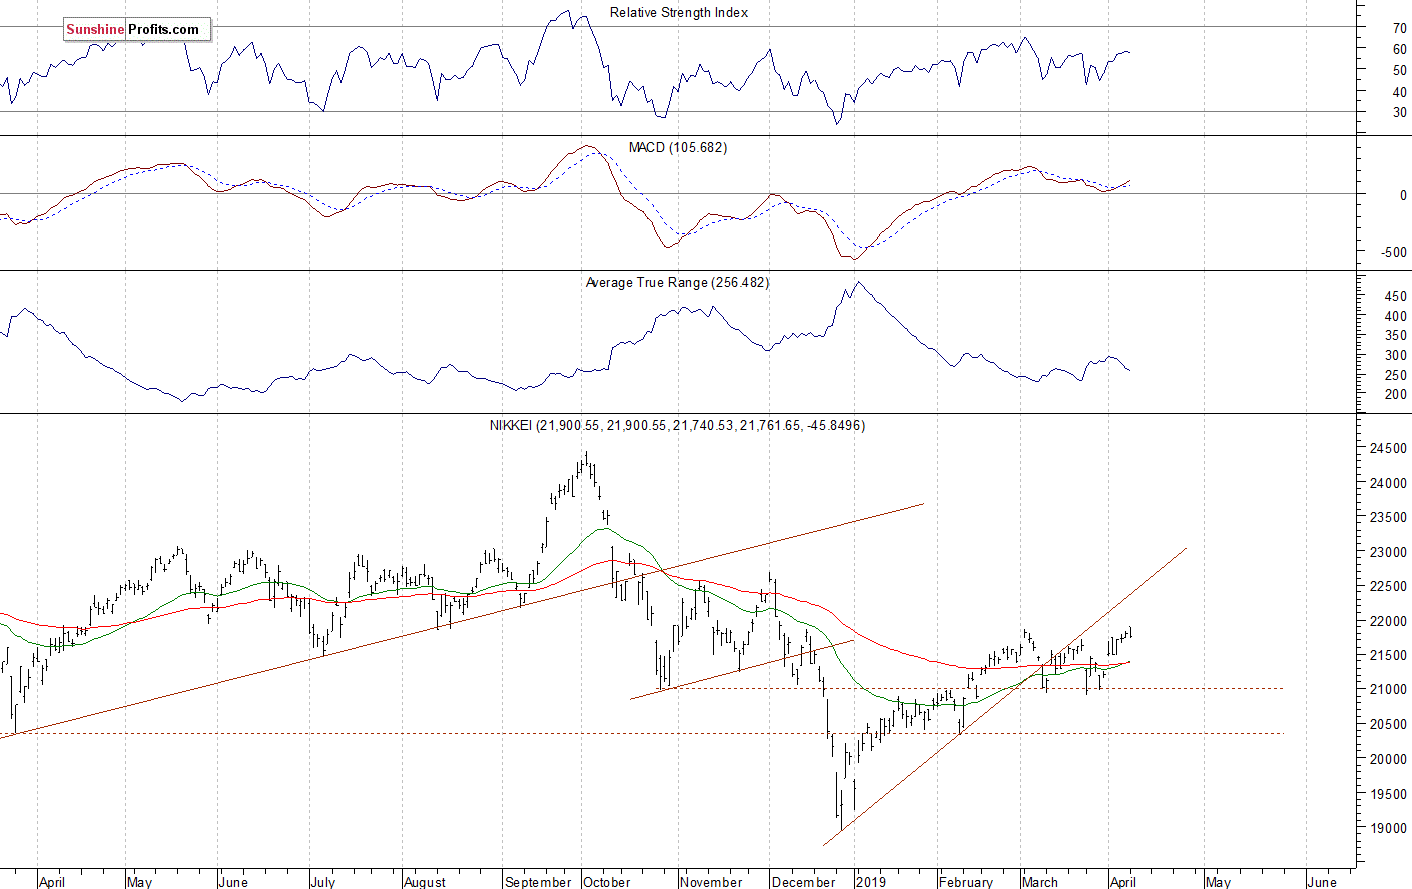
Let's take a look at the Japanese Nikkei 225 index. It accelerated the downtrend in late December, as it fell slightly below the 19,000 level. Then it was retracing the downtrend for two months. In March the market went sideways. Recently the index got close to 21,500-22,000 again. It still looks like a flat correction following the January-February advance:
The S&P 500 index slightly extended its short-term uptrend on Friday, as it got the highest since the early October. We wrote that the recent consolidation looked like a relatively flat correction within a three-month-long uptrend. And we were right. But will the market reach its last year’s record high? There may be some uncertainty, as the S&P 500 gets closer to the 2,900 resistance level.
Concluding, the S&P 500 index will likely open slightly lower today. We may see some profit-taking action following the recent rally.However, there have been no confirmed negative signals so far.
Want free follow-ups to the above article and details not available to 99%+ investors? Sign up to our free newsletter today!
Author

Paul Rejczak
Sunshine Profits
Paul Rejczak is a stock market strategist who has been known for the quality of his technical and fundamental analysis since the late nineties.


