S&P 500 at 2,900 Mark, Will Stocks Break Higher?

Stocks retraced some of their Tuesday’s decline yesterday, as they continued to fluctuate following the recent rally. The S&P 500 index traded slightly below the 2,900 mark. Will the uptrend continue despite some technical overbought conditions?
The U.S. stock market indexeswere mixed between 0.0% and +0.7% on Wednesday, as investors hesitated following Tuesday’s decline. The S&P 500 index retraced more of its October-December downward correction of 20.2%on Monday. The broad stock market's gauge is now just1.8% below September the 21st record high of 2,940.91. The Dow Jones Industrial Average was unchangedand the Nasdaq Composite gained0.7% on Wednesday.
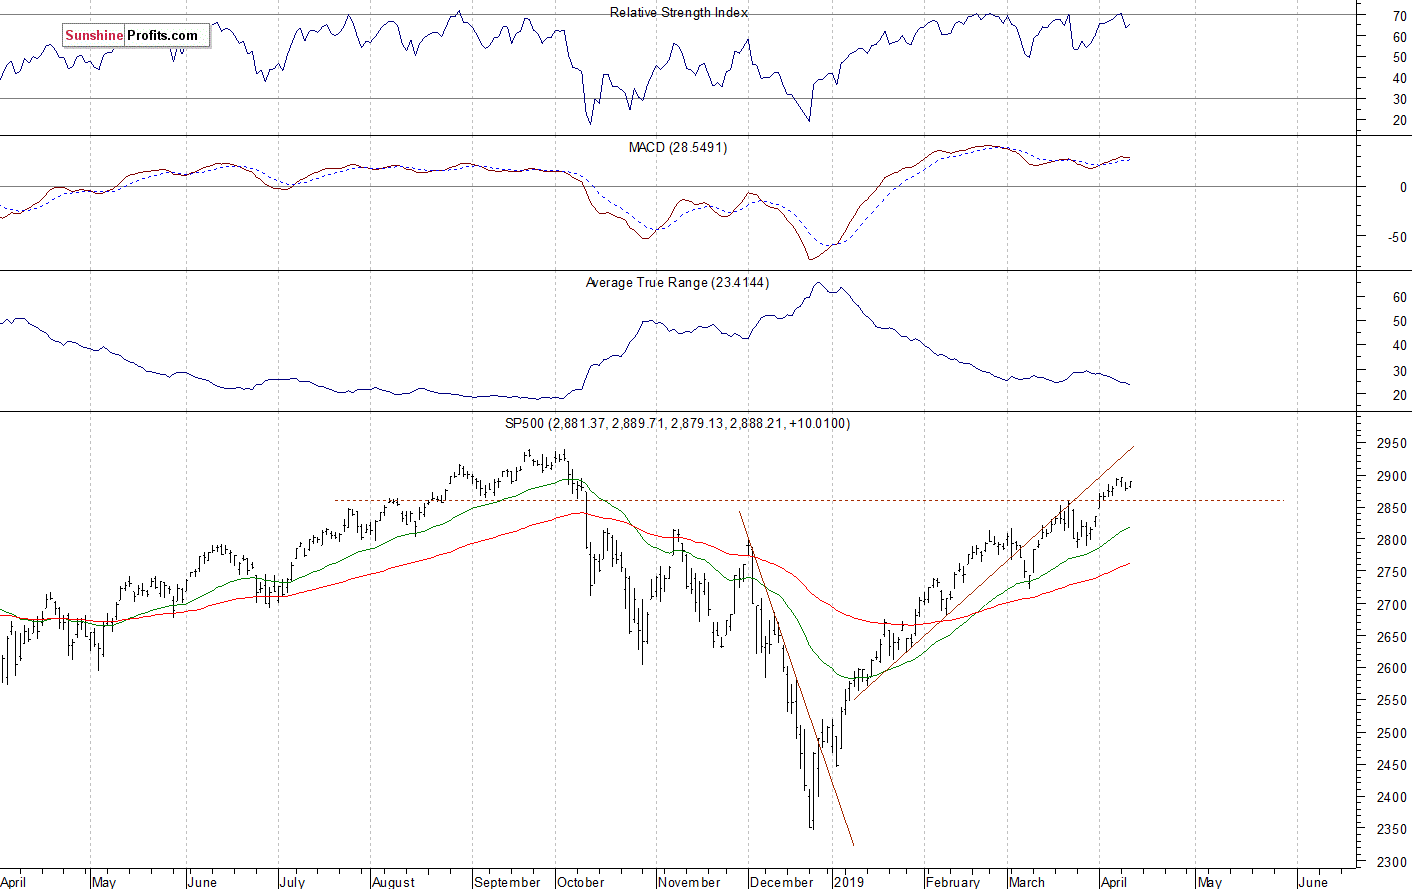
The nearest important resistance level of the S&P 500 index remains at 2,890-2,900, marked by some early October local highs. The next resistance level is at 2,920-2,940, marked by the mentioned record high, among others. On the other hand, the support level is at 2,860-2,865, marked by the recent local lows. The support level is also at 2,835-2,850, marked by the previous Monday’s daily gap up of 2,836.03-2,848.63.
The broad stock market retraced all of its December sell-off and it broke above the medium-term resistance level of around 2,800-2,820, marked by the October-November local highs recently. So is it still just a correction or a new medium-term uptrend? We may see an attempt at getting back to the record high. There have been no confirmed negative medium-termsignals so far. The index got closer to its last October all-time high, as we can see on the daily chart:
Resuming Uptrend?
Expectations before the opening of today's trading session are slightly positive, because the index futures contracts trade 0.1-0.2% above their Wednesday’s closing prices. The European stock market indexes have gained 0.2-0.8% so far. Investors will wait for some economic data announcements: Producer Price Index, Unemployment Claims at 8:30 a.m. There will also be several speeches from the FOMC Members today. The broad stock market will likelycontinue to fluctuate following the recent rally. There have been no confirmed negative signals so far.
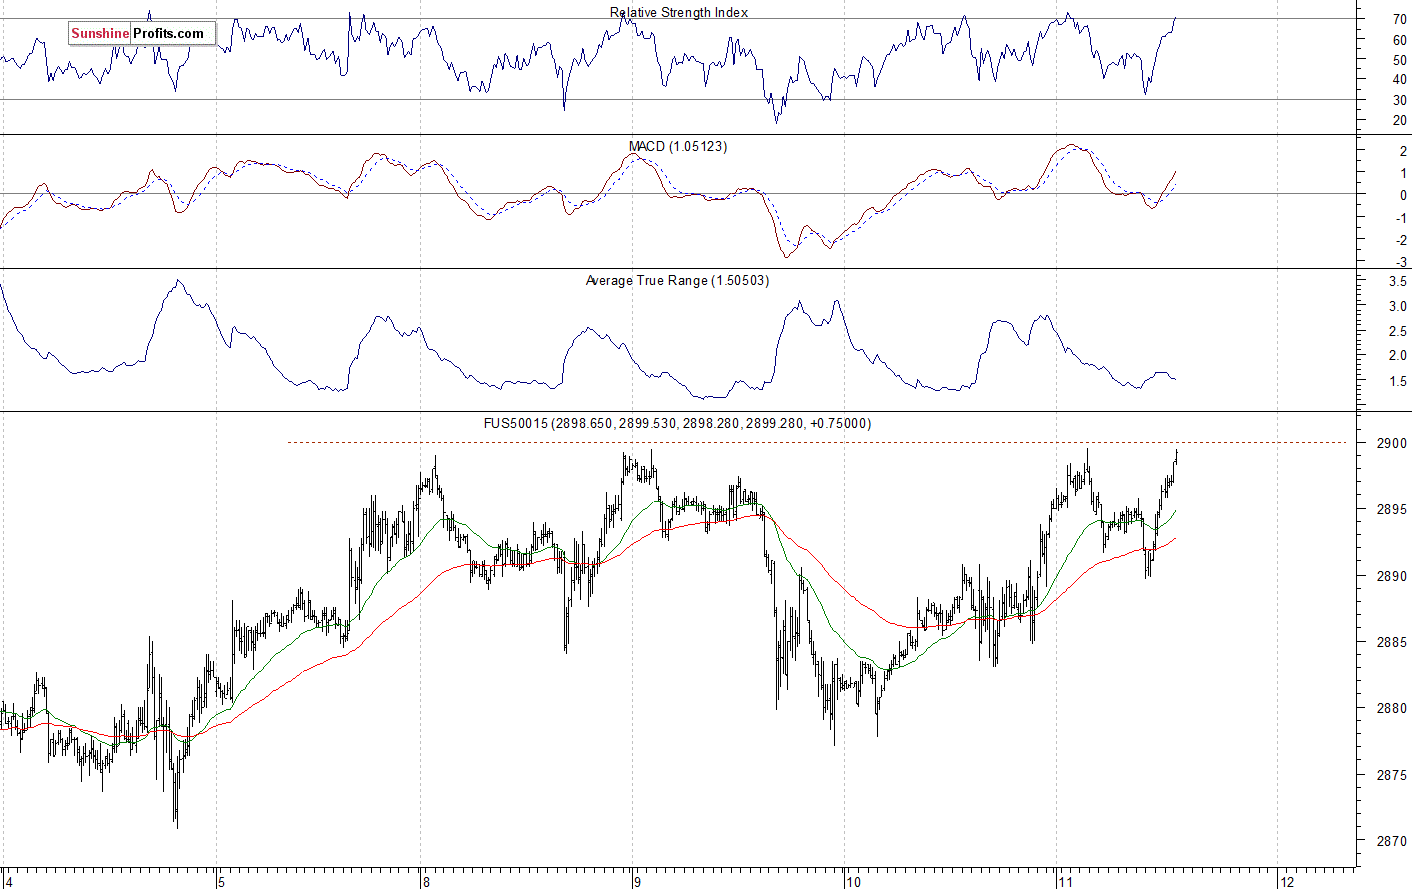
The S&P 500 futures contract trades within an intraday uptrend, as it retraces its overnight decline. The nearest important resistance level is at 2,900. On the other hand, the support level is at 2,890, among others. The futures contract is back at the 2,900 mark again, as the 15-minute chart shows:
Nasdaq Also Higher
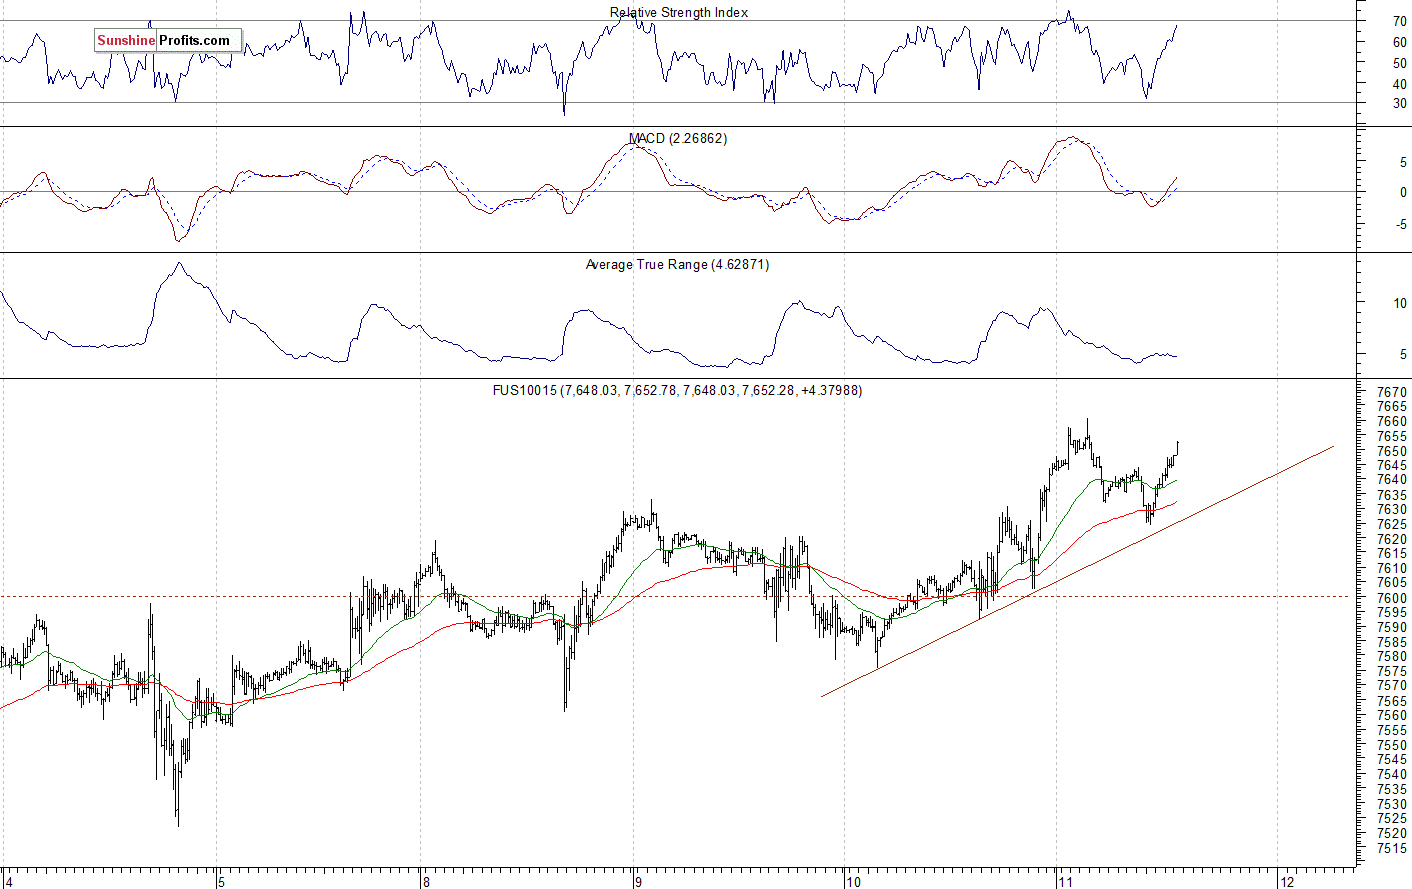
The technology Nasdaq 100 futures contract follows a similar path, as it trades within an intraday uptrend. The market slightly extended its medium-term uptrend yesterday. It has retraced most of the late last year’s sell-off. The nearest important resistance level is now at around 7,650-7,700. On the other hand, the support level is at 7,600. The Nasdaq futures contractis above the two-day-long upward trend line, as we can see on the 15-minute chart:
Big Cap Tech Stocks Close to Their Medium-Term Highs
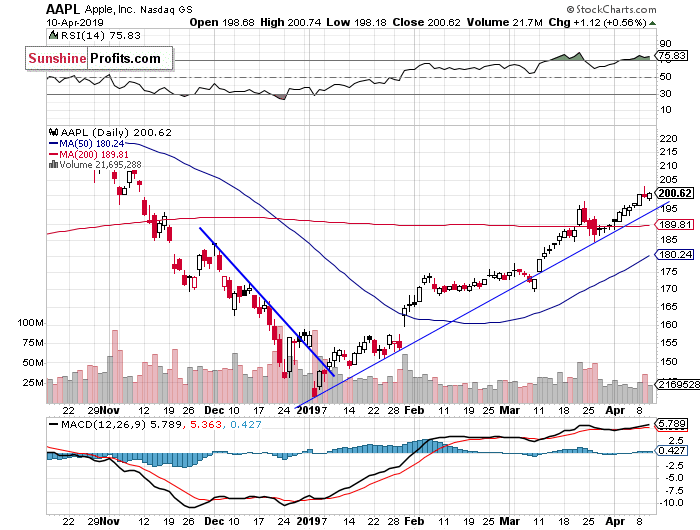
Let's take a look at the Apple, Inc. stock (AAPL) daily chart (chart courtesy of http://stockcharts.com). The stock accelerated its uptrend recentlyand it broke above the resistance level of $200on Tuesday.The market continues to trade abovethe medium-term upward trend line:
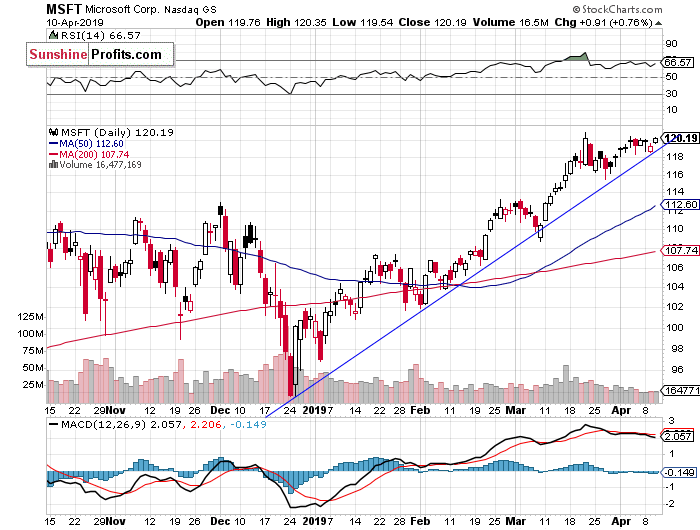
Now let's take a look at the daily chart of Microsoft Corp. (MSFT). The price remains close to the new record high. The resistance level is at around $120. The market continues to trade along its three-month-long upward trend line:
Dow Jones – Short-Term Uncertainty
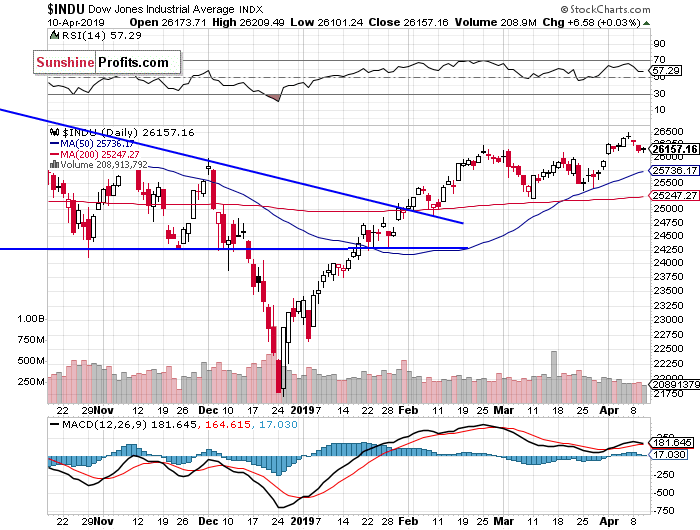
The Dow Jones Industrial Averagebroke above its February local highlast week and it extendedthe medium-term uptrend. The next resistance level is at around 26,800-27,000, marked by the last year’s topping pattern and the record high of 26,951.8. On Tuesday it retraced its recent advance. For now, it looks like a downward correction:
Nikkei Going Sideways
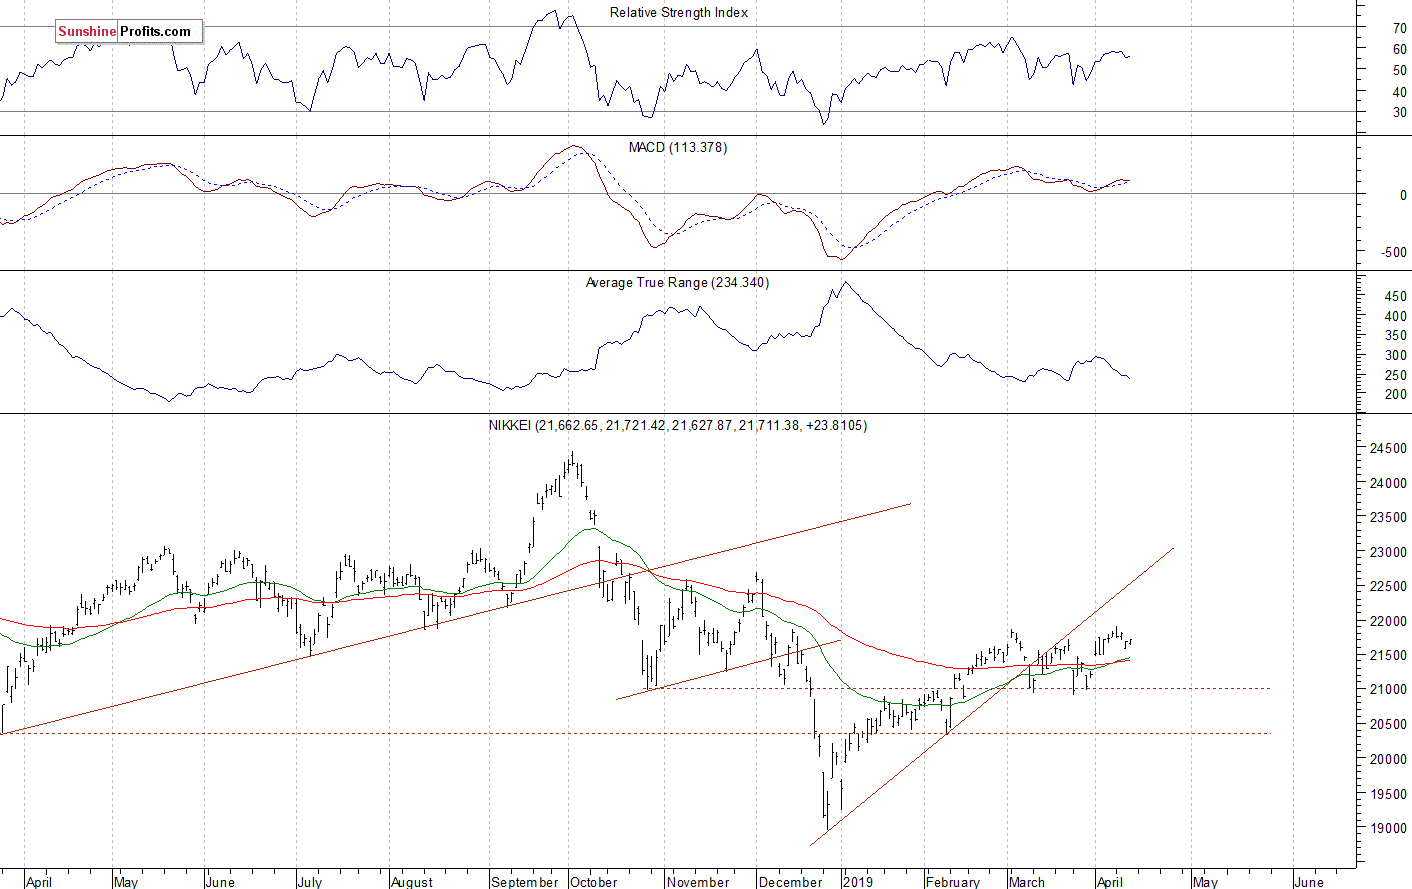
Let's take a look at the Japanese Nikkei 225 index. It accelerated the downtrend in late December, as it fell slightly below the 19,000 level. Then it was retracing the downtrend for two months. In March the market went sideways. Recently the index got close to 21,500-22,000 again. It still looks like a flat correction following the January-February advance:
The S&P 500 index slightly extended its short-term uptrend on Monday, as it got the highest since the early October. But on Tuesday it retraced some of the advance, after bouncing off a potential 2,900 resistance level. For now, it looks like a short-term downward correction.
Concluding, the S&P 500 index will likely open slightly higher today.We may see an attempt at breaking above the 2,900 mark. However, there may be some short-term uncertainty, as stocks trade close to their medium-term resistance level and their September’s record high.
Want free follow-ups to the above article and details not available to 99%+ investors? Sign up to our free newsletter today!
Author

Paul Rejczak
Sunshine Profits
Paul Rejczak is a stock market strategist who has been known for the quality of his technical and fundamental analysis since the late nineties.


