Soybeans To Soar Again
The soybean price had a cracker of a run recently and is now consolidating. Once this corrective phase is over I expect price to soar once more to even greater heights.
Let’s review the technicals beginning with the longer term yearly chart.
SOYBEANS YEARLY CHART
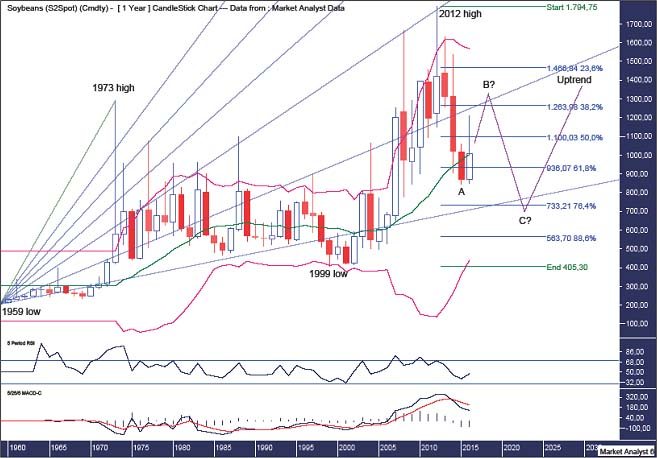
We can see price has busted out of its long term basing phase which took place between 1973 and 1999. This period saw a high of $1290 and a low of $405 Price is unlikely to ever go that low again and is now in the process of finding a new base low to work from.
Since the all time high set in 2012 at $1794 price has fallen back and I believe an ABC corrective formation is currently tracing itself out. I believe the wave A low is in place and price is now on its way to a wave B high. Once that high is in place the final move down to a wave C low should occur. This will obviously take many years to play out.
The Bollinger Bands show the middle band providing support with the wave A low nudging a bit below that band. I doubt price will get back up to the upper band now while I expect the final wave C low to be back around the lower band.
I have drawn a Fibonacci Fan from the 1959 low to 1973 high. This shows some nice price symmetry with the 2012 high back at resistance from the 61.8% angle. Price is currently trading between the 76.4% and 88.6% angles and I favour the wave B high to be around resistance from the 76.4% angle and the wave C low to be back around support from the 88.6% angle.
I have added Fibonacci retracement levels of the move up from the 1999 low to 2012 high and I expect the final wave C low to be down at least at the 76.47% level at $733 and perhaps even a touch lower. I doubt price will get as low as the 88.6% level at $563 but it may go close.
The RSI is currently marginally in weak territory while the MACD indicator is bearish so clearly nothing to get excited about from a long term perspective. Reducing the time frame may be more palatable for the bulls though.
SOYBEANS MONTHLY CHART
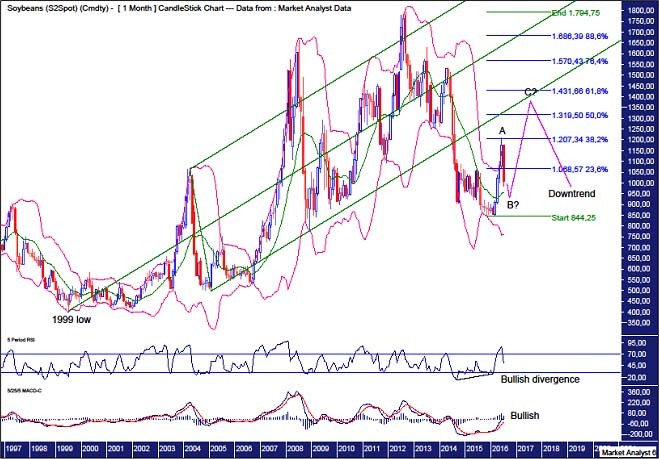
I showed this chart back in analysis, titled Soybeans Technical Outlook, produced in February 2015 and it was my expectation that price would rally back up to the lower Andrew’s Pitchfork channel. Nothing has changed there and I am now looking for one final surge up to around that line which should act as resistance.
I believe the move up will take an ABC corrective form with the final high wave C. I believe wave B is still in motion however.
As for where the wave B low will be, the middle Bollinger Band looms large. Perhaps a touch lower as price gives that support zone a good test.
I have added Fibonacci retracement levels of the move down from all time high to wave A low and I am targeting price to rally up to at least the 50% level at $1319 while 61.8% level at $1431 is also a real possibility.
The RSI has a bullish divergence in place while the MACD indicator is bullish.
SOYBEANS WEEKLY CHART
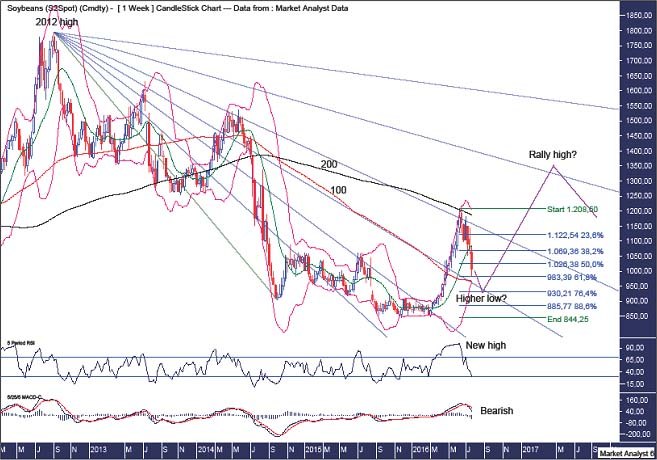
We can see the nice price rise recently and I expect another similar whoosh to come shortly. Before that, we need a higher low.
The Bollinger Bands show price headed for the lower band and I expect price to push into this band to set up the higher low.
The Fibonacci Fan drawn from the 2012 high shows the recent high was at resistance from the 61.8% angle and I am now looking for the higher low to be around support from the 50% angle. Price should then trade high and the 76.4% angle will be one to watch for the final rally high.
I have added Fibonacci retracement levels of the recent move up and I am targeting the higher low to be around the 76.4% level which stands at $930.
I have added moving averages with time periods of 100 (red) and 200 (black). The recent high was at resistance from the black line while the higher low may form around support from the red line.
The RSI showed a new high at the recent price high which is bullish in that the final rally high often creates a bearish divergence.
The MACD indicator is bearish so lower prices are likely over the coming weeks.
Summing up, after the current correction reaches its conclusion another solid move should once again take place.
Author

Austin Galt
The Voodoo Analyst
Austin Galt is the author of the flagship Voodoo Analyst and Voodoo Gold & Silver Stocks monthly newsletters.


