Soybeans commodities charts Elliott Wave technical analysis [Video]
![Soybeans commodities charts Elliott Wave technical analysis [Video]](https://editorial.fxstreet.com/images/Markets/Commodities/Agriculture/soybean1-637443204449862158_XtraLarge.jpg)
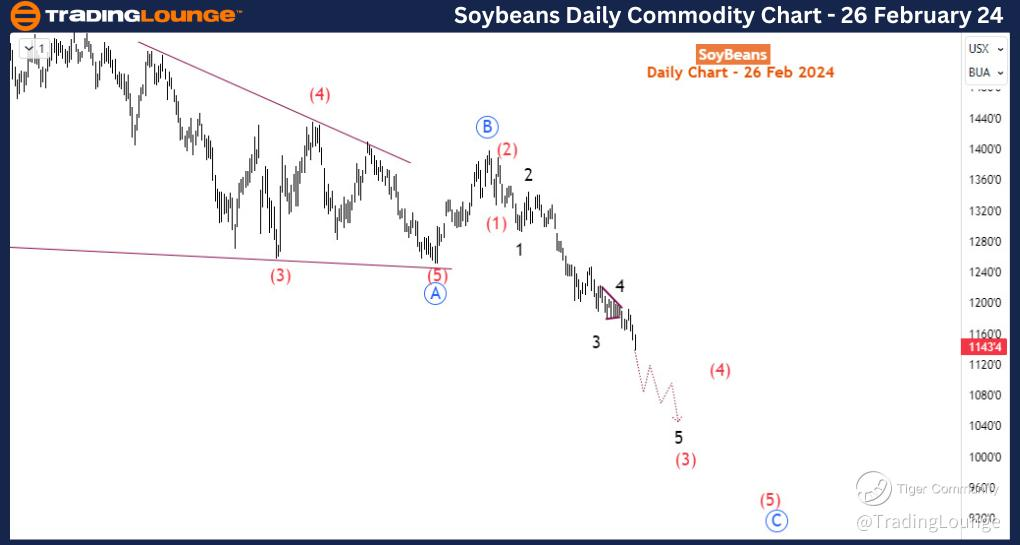
Soybean Elliott Wave analysis - Bearish trend remains intact
Function - Trend.
Mode - Impulsive.
Structure - Impulse Wave.
Position - Black Wave 5 of higher degree red wave (3).
Direction - Black wave 5 of (3) is still in progress.
Soybean's Elliott Wave Analysis suggests a continuation of its long-term bearish correction initiated in June 2022. Last week, Soybean broke below the 1163 swing low, indicating further downward momentum. On the daily timeframe, the current bearish phase is seen as corrective, with blue wave A completing a leading diagonal pattern followed by a shallow blue wave B correction ending in November 2023. The subsequent break below 1250, the blue wave A low, confirmed the continuation of the bearish trend, marking the beginning of the bearish impulse wave pattern for blue wave C.
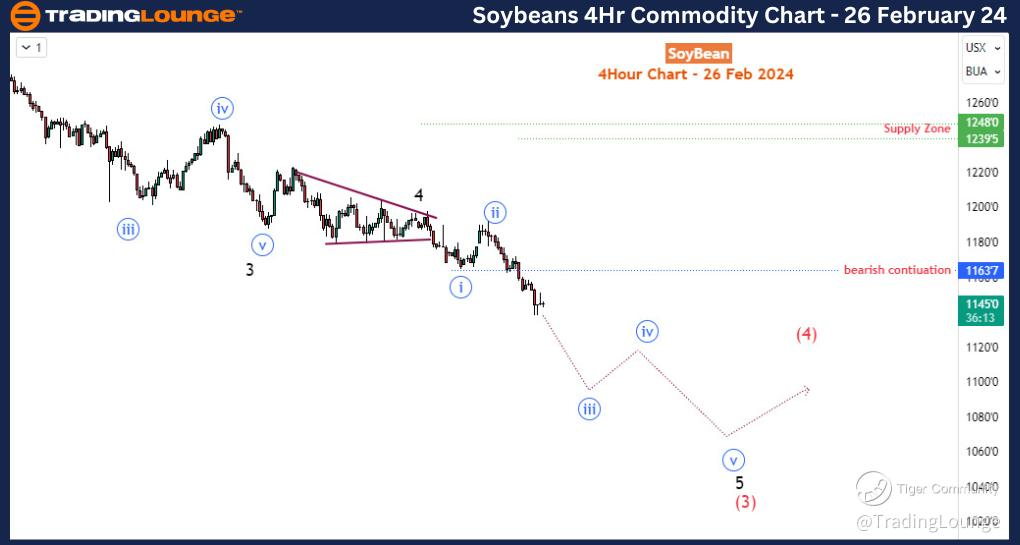
Zooming in on the 4-hour timeframe reveals the development of the impulse wave for blue wave C. The current price action appears to be in the early stages of black wave 5 of red (3) of blue 5. This suggests that the bearish momentum is not yet exhausted, implying the potential for further downside movement in the coming weeks, unless there is a significant rally above 1197. It is anticipated that blue wave iii of 5 will likely decline towards the 1100 level.
Given this technical outlook, the recommended strategy for trading Soybean is to sell into bounces and avoid buying at lows until there is confirmation of a substantial bullish correction. This approach aligns with the expectation of continued bearish pressure on the commodity in the near term. Traders should remain cautious and attentive to price action, waiting for signs of a potential shift in the overall market sentiment before considering long positions.
Overall, the analysis suggests a bearish outlook for Soybean, with the potential for further downside movement in the short to medium term.
Technical Analyst: Sanmi Adeagbo.
Author

Peter Mathers
TradingLounge
Peter Mathers started actively trading in 1982. He began his career at Hoei and Shoin, a Japanese futures trading company.


