SOTU Cometh [Video]
![SOTU Cometh [Video]](https://editorial.fxstreet.com/images/Markets/Commodities/Metals/Gold/hand-full-of-gold-nuggets-53773200_XtraLarge.jpg)
US Dollar: Mar '23 USD is Up at 103.575.
Energies: Mar '23 Crude is Up at 75.33.
Financials: The Mar '23 30 Year T-Bond is Down 2 ticks and trading at 128.30.
Indices: The Mar '23 S&P 500 Emini ES contract is 2 ticks Higher and trading at 4124.00.
Gold: The Apr'23 Gold contract is trading Up at 1881.30. Gold is 18 ticks Higher than its close.
Initial conclusion
This is not a correlated market. The dollar is Up, and Crude is Up which is not normal, and the 30 Year T-Bond is trading Lower. The Financials should always correlate with the US dollar such that if the dollar is lower, then the bonds should follow and vice-versa. The S&P is Higher, and Crude is trading Higher which is not correlated. Gold is trading Higher which is not correlated with the US dollar trading Up. I tend to believe that Gold has an inverse relationship with the US Dollar as when the US Dollar is down, Gold tends to rise in value and vice-versa. Think of it as a seesaw, when one is up the other should be down. I point this out to you to make you aware that when we don't have a correlated market, it means something is wrong. As traders you need to be aware of this and proceed with your eyes wide open. Currently Asia is trading Mixed with half the exchanges Higher and the other half Lower. At the present time Europe is trading Higher with the exception of the German Dax which is Lower.
Possible challenges to traders Today
-
Trade Balance is out at 8:30 AM EST. This is Major.
-
IBD/TIPP Economic Optimism - tentative. This is Major.
-
Fed Chair Powell Speaks at 12 noon EST. This is Major.
-
FOMC Member Barr Speaks at 2 PM EST. This is Major.
-
Consumer Credit m/m is out at 3 PM EST. This is Major.
Treasuries
Traders, please note that we've changed the Bond instrument from the 30 year (ZB) to the 10 year (ZN). They work exactly the same.
We've elected to switch gears a bit and show correlation between the 10-year bond (ZN) and the S&P futures contract. The S&P contract is the Standard and Poor's, and the purpose is to show reverse correlation between the two instruments. Remember it's likened to a seesaw, when up goes up the other should go down and vice versa.
Yesterday the ZN hit a High at around 10:30 AM EST. The S&P was trading Lower at around the same time. If you look at the charts below ZN gave a signal at around 10:30 PM and the S&P gave a signal at around the same time. Look at the charts below and you'll see a pattern for both assets. ZN hit a High at around 10:30 AM and migrated Lower. These charts represent the newest version of MultiCharts and I've changed the timeframe to a 15-minute chart to display better. This represented a Short opportunity on the 10-year note, as a trader you could have netted about a dozen ticks per contract on this trade. Each tick is worth $15.625. Please note: the front month for the ZN is now Mar '23. The S&P contract is now Mar' 23 as well. I've changed the format to filled Candlesticks (not hollow) such that it may be more apparent and visible.
Charts courtesy of MultiCharts built on an AMP platform
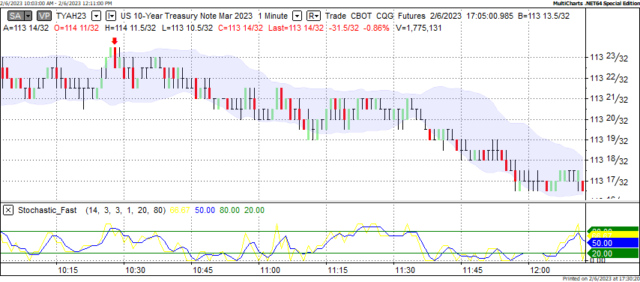
ZN - Mar 2023 - 2/6/23
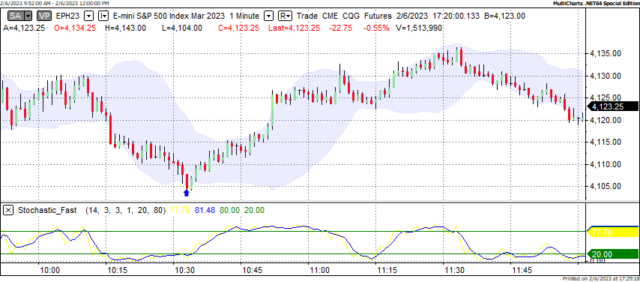
S&P - Mar 2023 - 2/6/23
Bias
Yesterday we gave the markets a Downside bias as the USD, Crude and Gold were all trading Higher and thus we gave the markets a Downside bias. The markets didn't disappoint as the Dow closed Lower by 35 points and the other indices traded Lower as well. Today we aren't dealing with a correlated market and our bias is Neutral.
Could this change? Of Course. Remember anything can happen in a volatile market.
Commentary
Yesterday morning as we watched the global markets unfold, it became abundantly clear to us that the markets would favor a Downside Day. The markets didn't disappoint as all the major US markets closed Lower yesterday. Today we do have some news as opposed to yesterday where we had practically none. We think the markets will prepare itself for the State of the Union address to be delivered by President Joe Biden and will air tonight at 9 PM EST. What the President will say is yet to be seen. He will, at the very least talk about his accomplishments thus far. The Republicans will respond to the SOTU, hopefully at the end of his speech and not before. How will this affect the markets? Only time will tell...
Author

Nick Mastrandrea
Market Tea Leaves


