Solid Asset Appreciation Boosts Household Net Worth in Q4

Household asset holdings rose 2 percent in Q4, led by financial asset and real estate gains. Real per capita household net worth is at an all-time high, providing a tailwind to the U.S. consumer for 2017.
How Do Household Asset Holdings Compare to Previous Peaks?
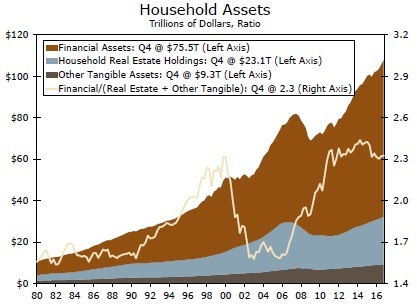
U.S. economic growth has been powered by personal consumption over the past few quarters. Some headwinds have emerged, however, such as faster inflation, higher interest rates and a gradual slowdown in employment growth. One counterweight to this has been robust asset appreciation. Household financial and tangible asset appreciation remained firm to end 2016, increasing 2.1 percent for the second consecutive quarter. Real per capita household net worth is now an all-time high $254,006, well-above the pre-recession peak of $234,050 reached in Q1 2007.
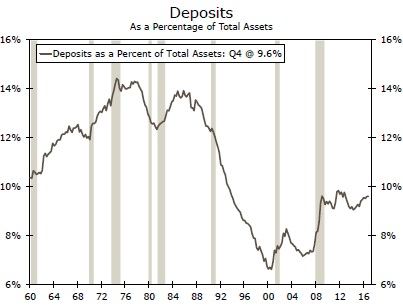
Typical household asset holdings in this cycle are more heavily tilted toward financial assets than tangible assets, such as real estate (top chart). This trend is more reminiscent of the late 1990s tech boom than the housing boom that occurred in the 2000s. One encouraging difference between today and the tech bubble period is much higher bank deposit holdings in the current period. Bank deposits as a share of total assets shot up during the Great Recession, reflecting more cautious behavior and asset depreciation at the time. However, despite robust asset appreciation in the eight years since the recession ended, deposits as a share of total assets have largely held steady (middle chart). Admittedly, deposit holdings still represent a much smaller share of household assets than they did 30 years ago, and it remains to be seen whether households will at some point shed their cautious approach. For the time being, however, consumers appear a bit better positioned late in the cycle relative to the previous two peaks.
Asset appreciation has continued to start the year. The S&P 500 is up about 6 percent thus far in 2017, and home price appreciation has remained steady amid still lean inventories. Thus it seems likely that household net worth will continue to trek higher in Q1, explaining at least part of the recent run up in consumer confidence. We look for real personal consumption to grow 2.7 percent in 2017, which would match 2016's pace.
Fed Keeping Asset Prices in Mind
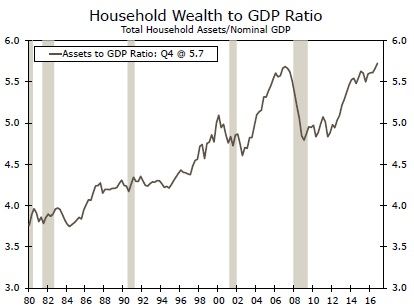
Fed officials have at times made note of rising asset prices and have raised concerns about the effect keeping interest rates too low for too long might have on asset valuations. Prior to the Fed speak that significantly raised the probability of a March rate hike, there were questions about whether the "hard" economic data had improved enough to warrant back-to-back rate hikes. Perhaps the recent strength in asset prices played a role in the Fed's decision. As the bottom chart illustrates, household assets relative to the size of the economy is historically high, with the peak of the housing bubble the only recent comparable period. If this trend continues and the Fed is indeed weighing asset valuations in its interest rate decision making, further tightening would likely be on the horizon.
Author

Wells Fargo Research Team
Wells Fargo


