Soaring rents understate inflation

It's no surprise in this corner as Corelogic notes Metro-Level Rent Inflation.
Last month we showed that U.S. inflation may be underestimated due to the use of a measure called owners’ equivalent rent, which makes up 30% of the core consumer price index. When the CoreLogic single-family rent index is used as an alternative measure for price changes in owner-occupied housing, we saw core inflation increasing by one-to-two percentage points faster than what was reported from April to July of 2021. [Mish Note: 30% is an error it's 24%]
The CoreLogic single-family rent index is also available for more than 100 metro areas, which can be used to compute metro-level inflation measures. Let’s look at two metro areas from the Southwest U.S. that illustrate how inflation appears to be underestimated and delayed in the core CPI.
Population growth in Phoenix, Arizona has been amongst the highest in the country, leading to rent increases.
Rents in Phoenix have been growing the fastest of the metro areas covered by the CoreLogic single-family rent index for the past two years. Phoenix single-family rents increased 19% in July 2021, more than double the national rate. However, the owners’ equivalent rent measure used in the core CPI grew by just 5%.
Houston rents far outpace OER
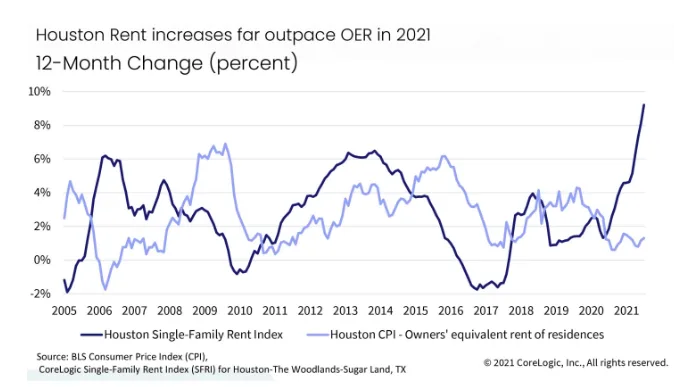
In the case of Houston, Texas the CoreLogic single-family rent index increased 9% for July, compared with 1% for the owners’ equivalent rent. These measures can be compared for a longer time period in Houston, and we can see that not only is single-family rent growth more variable than the owners’ equivalent rent, but it also experiences turning points sooner.
These numbers are not surprising in the least. I have been complaining about OER for years.
Not only does OER lag rent, but it brutally lags actual housing prices.
As noted previously OER is a mythical price that one would pay to rent one's own house from oneself, unfurnished and without utilities.
CPI year-over-year
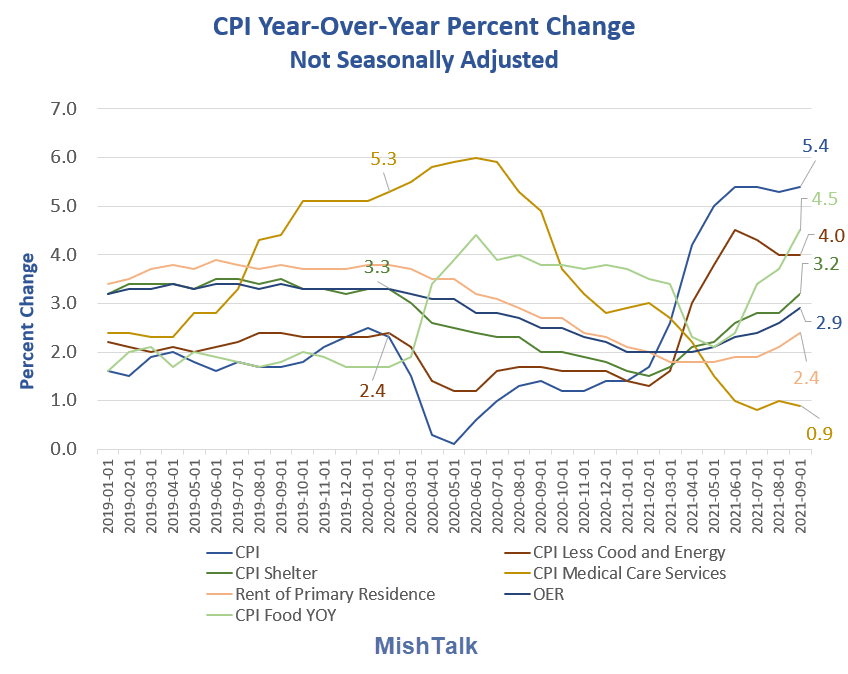
The BLS released CPI data for September on Wednesday.
CPI details
-
The CPI is up 5.4% year-over-year.
-
OER is up 2.9% year-over-year.
-
Rent is 2.4% year-over-year.
Real interest rates hit new record low as home prices hit new record high
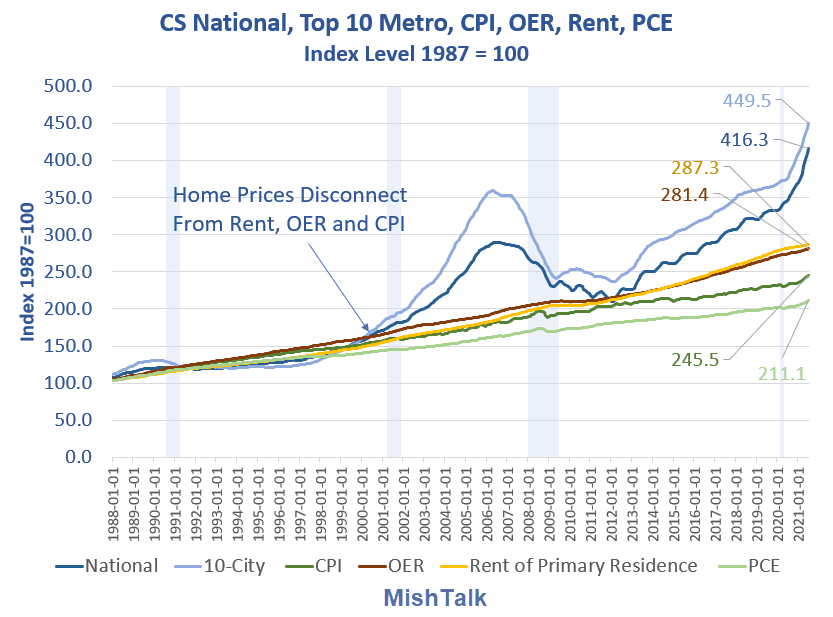
Case-Shiller home prices hit a new year-over-year high in July. Correspondingly, real interest rates hit a new low for the series. The latest home price data is as of July.
The BLS does not count home prices as a consumer expense. It used to. But now it calls home prices a "capital expense".
Until 2000 it did not matter. Rent, OER, and home prices all moved in tandem.
Now they don't.
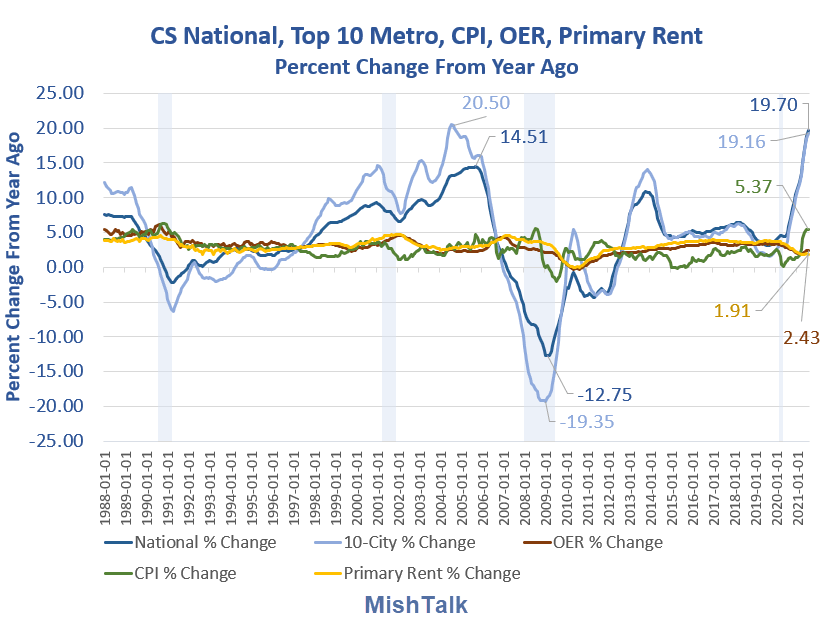
Key points (as of July Case-Shiller Data)
-
The National home price index rose 19.7% from a year ago setting a new record for the series, easily beating the housing bubble max increase of 14.5%.
-
The 10-city metro average rose 19.16% from a year ago but still under the housing bubble peak of 20.5%.
-
According to the BLS, rent was only up 1.91% from a year ago.
-
Owners' Equivalent Rent (OER), the mythical price one would pay to rent one's own home from oneself, unfurnished and without utilities, was allegedly up a mere 2.43% year-over-year.
-
The CPI for July was up 5.37% from a year ago.
It's Inflation Stupid!
OK home prices are a capital expense. So what?
Inflation matters, not just alleged consumer inflation.
CS National, Top 10 Metro, CPI, OER Percent Change
Home prices are up 19.7% from a year ago, national average.
If we substitute Case-Shiller home prices for OER in the CPI here are the results.
Inflation measures
-
CS National: 8.82%.
-
CS 10-City Metro: 8.69.
-
CPI: 5.37%.
As of July, I pegged inflation at 8.82% vs the CPI at 5.37%.
Author

Mike “Mish” Shedlock's
Sitka Pacific Capital Management,Llc


