XRP pulls back as subdued ETF inflows, layered resistance cap upside
- XRP consolidates above $1.23 after encountering strong supply at $1.28.
- Mild capital inflows through spot ETFs and derivatives weigh on XRP’s rebound, as the 50-day EMA resistance persists.
- XRP shows signs of stability, backed by a neutral RSI and a MACD buy signal.

Ripple (XRP) remains elevated above $1.23 at the time of writing on Tuesday, struggling amid a capped upside. Despite an improved overall market sentiment driven by news of a peace agreement between the United States and Iran to end the war in the Middle East, capital inflows remain notably subdued.
The official peace deal signing ceremony is scheduled for Friday, with the US expected to remove the naval blockade on Iranian ports while Iran reopens the Strait of Hormuz, which has put a chokehold on global Oil and Gas supplies since the war broke out.
XRP ETFs post modest capital inflows
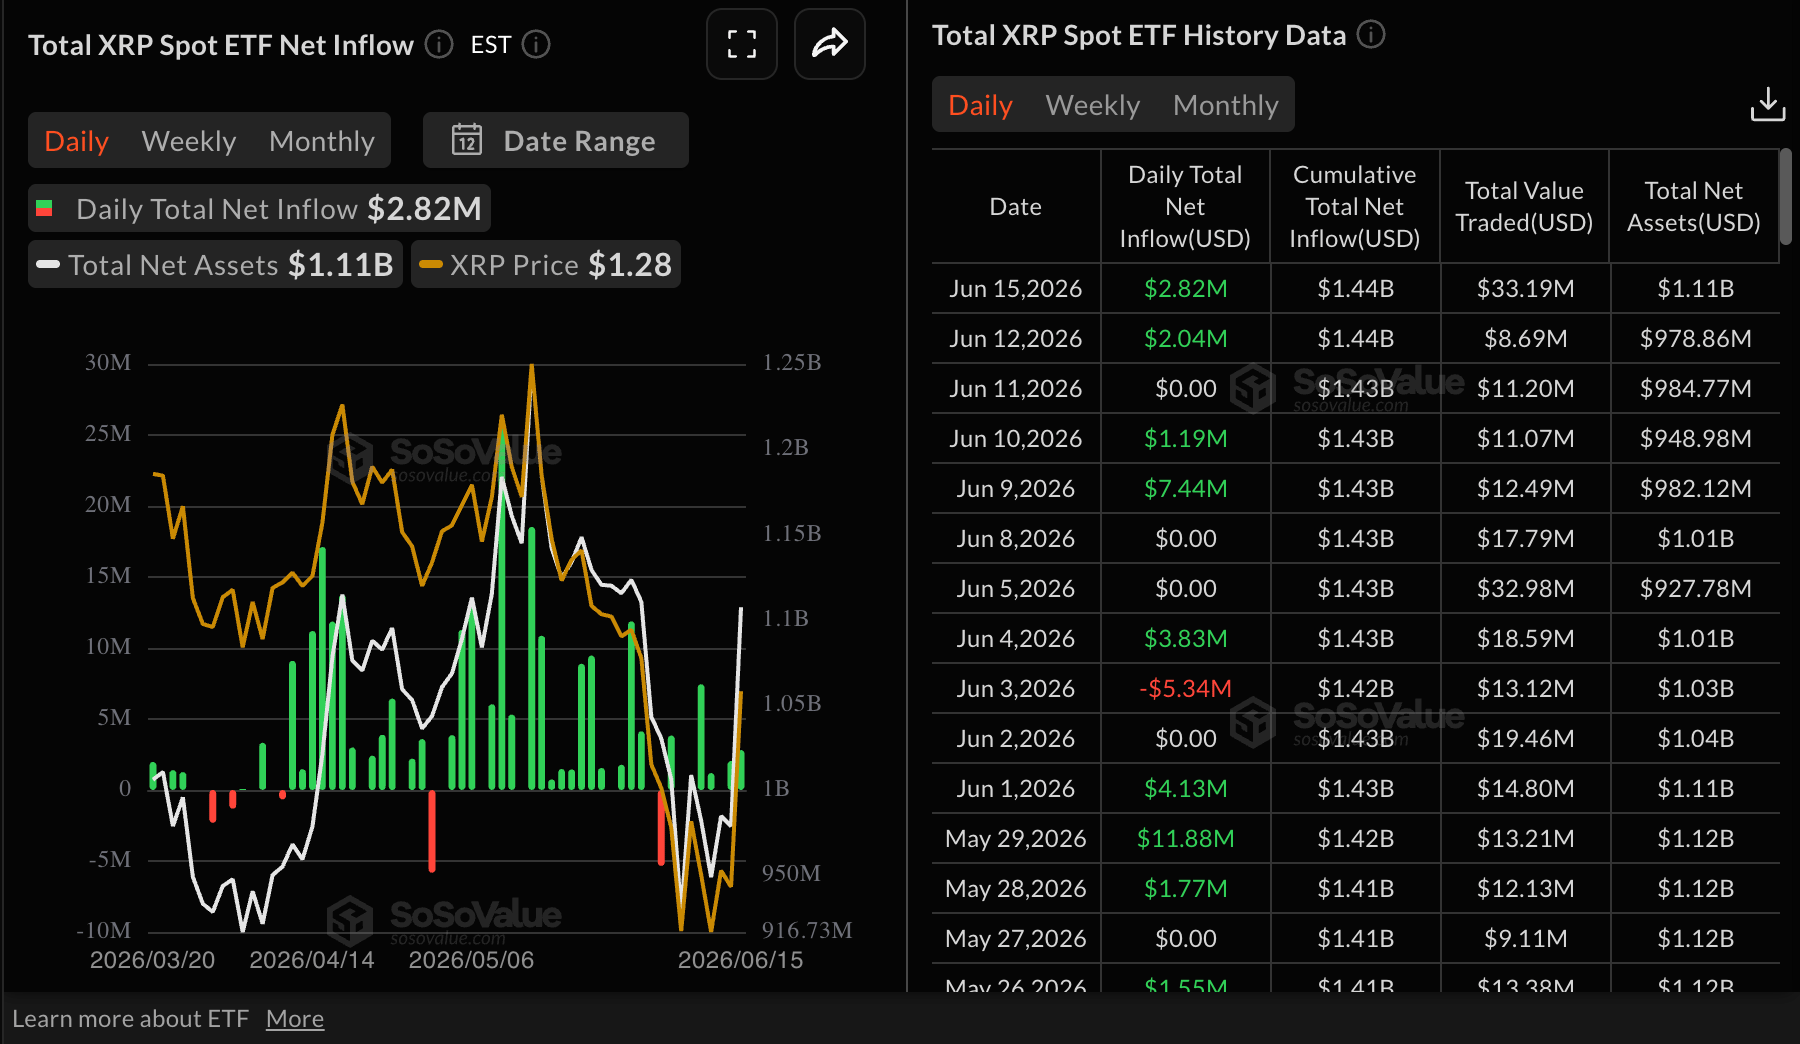
Institutional interest in XRP steadied on Monday, with spot Exchange-Traded Funds (ETFs) recording mild inflows of $2.82 million. Total assets under management climbed back above $1 billion while cumulative inflows stand at $1.44 billion, according to SoSoValue.
Should demand remain muted, the ongoing absence of significant capital inflows through ETFs could continue to place downward pressure on price performance.
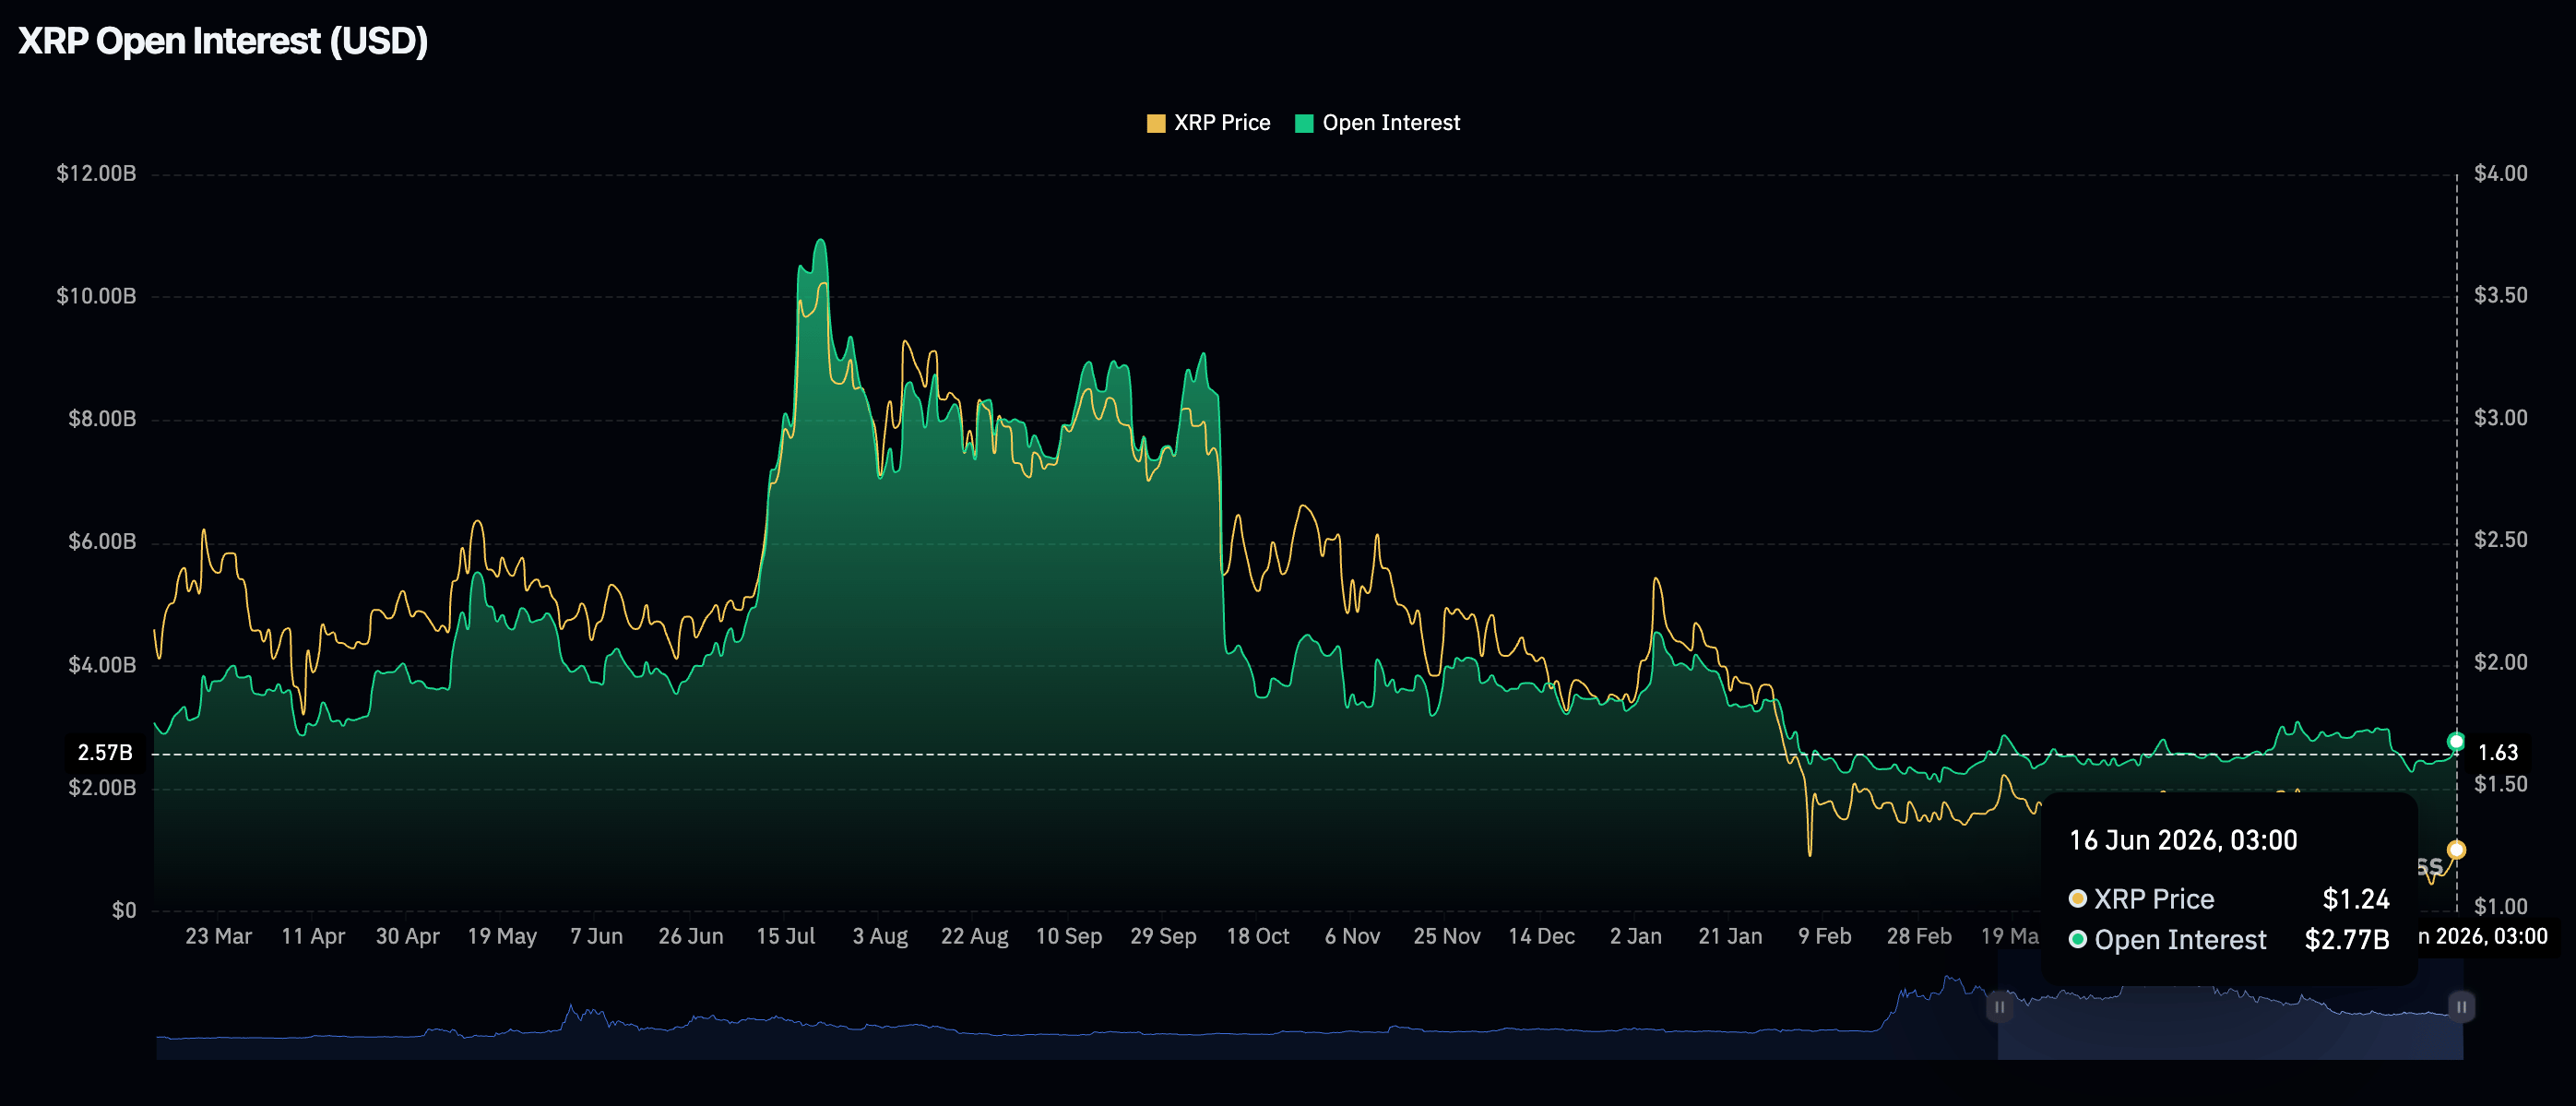
The XRP futures OI is gradually rising but remains significantly subdued, given the record set in futures Open Interest (OI) at $10.94 billion in July. CoinGlass data shows the OI averaging $2.77 billion on Tuesday, up from $2.54 billion the day before.
Derivatives data also highlights a direct correlation between the derivatives market and the XRP price, which can often increase the odds of an extended rebound as long as retail demand expands.
Price analysis: XRP trades amid fragile momentum
XRP hovers around $1.23 while remaining under a bearish near-term bias as price holds below the 50-day Exponential Moving Average (EMA) at $1.28, with the 100-day EMA at $1.38 and the 200-day EMA at $1.58 reinforcing a layered overhead supply zone.
A downward resistance trendline, whose key break level falls roughly at $1.32, further caps the recovery. However, the Moving Average Convergence Divergence (MACD) histogram has turned positive on the daily chart and the Relative Strength Index (RSI) hovers around 51, hinting at improving but still fragile upside momentum.
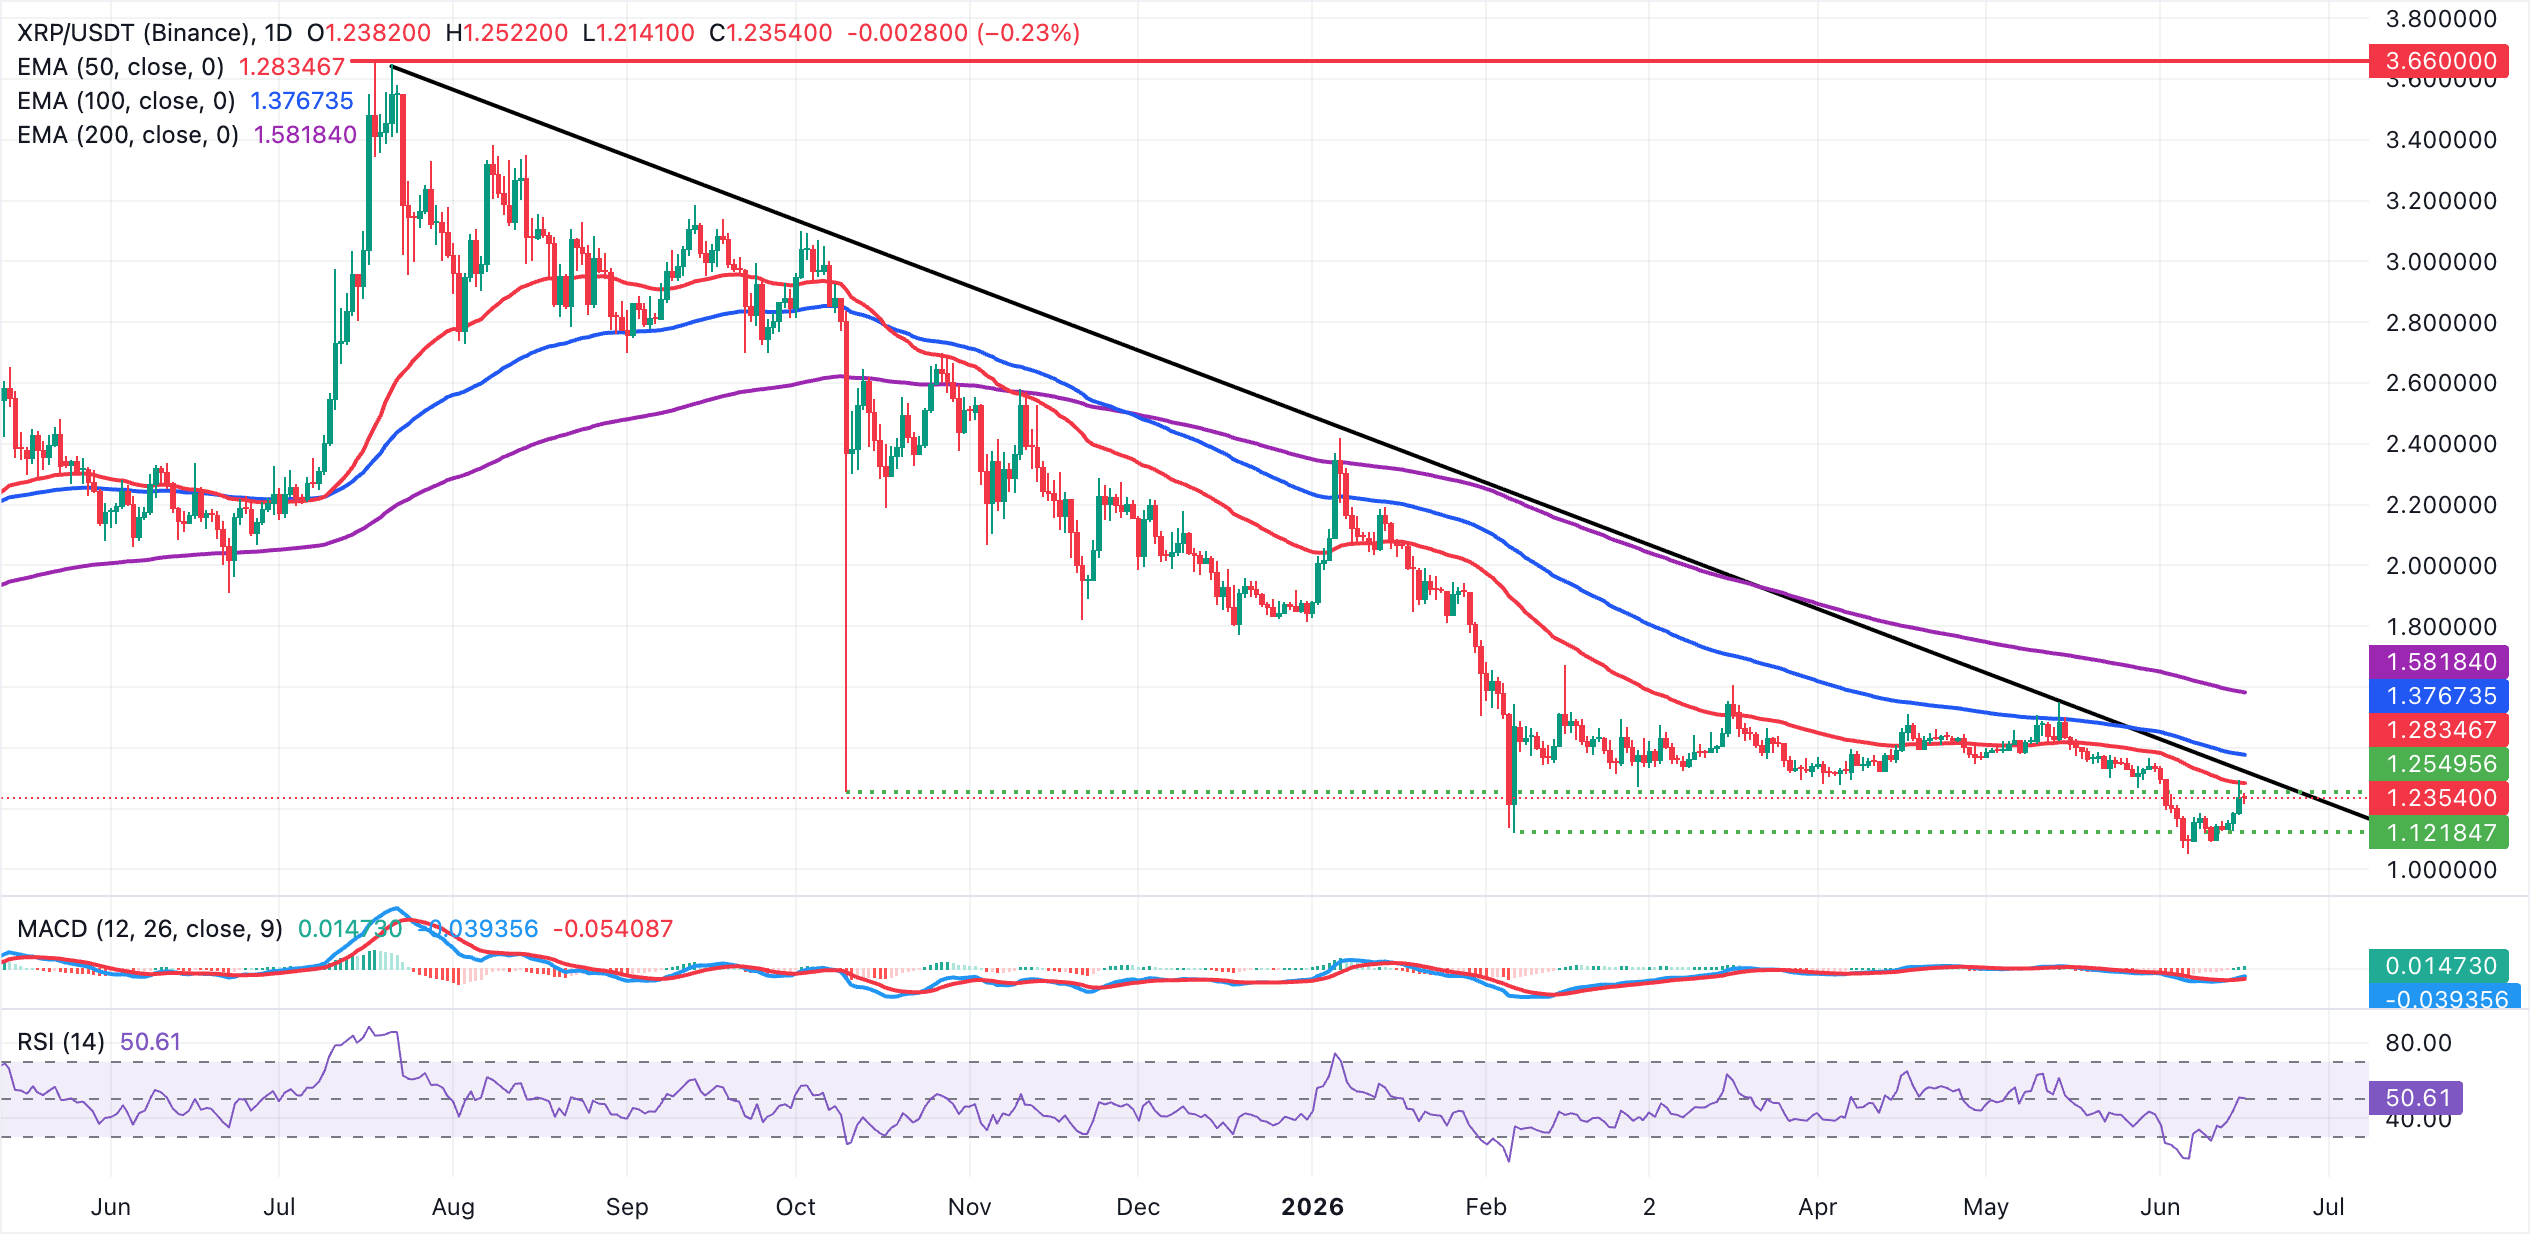
On the topside, initial resistance lies at the 50-day EMA around $1.28, followed by the trendline break level near $1.32. A sustained clearance of these barriers would be needed to expose the 100-day EMA at approximately $1.38 and then the 200-day EMA near $1.58.
If supply overwhelms demand, pullbacks from current levels would leave XRP vulnerable to fresh lows towards $1.00 on the daily chart until a new demand floor is established.
(The technical analysis of this story was written with the help of an AI tool.)
Ripple FAQs
Ripple is a payments company that specializes in cross-border remittance. The company does this by leveraging blockchain technology. RippleNet is a network used for payments transfer created by Ripple Labs Inc. and is open to financial institutions worldwide. The company also leverages the XRP token.
XRP is the native token of the decentralized blockchain XRPLedger. The token is used by Ripple Labs to facilitate transactions on the XRPLedger, helping financial institutions transfer value in a borderless manner. XRP therefore facilitates trustless and instant payments on the XRPLedger chain, helping financial firms save on the cost of transacting worldwide.
XRPLedger is based on a distributed ledger technology and the blockchain using XRP to power transactions. The ledger is different from other blockchains as it has a built-in inflammatory protocol that helps fight spam and distributed denial-of-service (DDOS) attacks. The XRPL is maintained by a peer-to-peer network known as the global XRP Ledger community.
XRP uses the interledger standard. This is a blockchain protocol that aids payments across different networks. For instance, XRP’s blockchain can connect the ledgers of two or more banks. This effectively removes intermediaries and the need for centralization in the system. XRP acts as the native token of the XRPLedger blockchain engineered by Jed McCaleb, Arthur Britto and David Schwartz.
Author

John Isige
FXStreet
John Isige is a seasoned cryptocurrency journalist and markets analyst committed to delivering high-quality, actionable insights tailored to traders, investors, and crypto enthusiasts. He enjoys deep dives into emerging Web3 tren




