Silver Volume Extreme as in April 2013

During yesterday’s session silver moved back and forth in a volatile manner on volume that was the highest since April 2013. There were a few volume spikes in the meantime, but none as big as what we saw yesterday. The silver market is being very loud. But are you listening?
It may be hard to notice silver’s signs with all that’s happening in the USD Index and given the rally in gold stocks, but it’s definitely worth it. Let’s investigate (charts courtesy of http://stockcharts.com).
The volume in silver was epic. One could say that it’s because there was no regular session on Monday, but during the previous years there were also other cases when there were market holidays and in no other case was the volume this big. In other words, the volume is extreme even if we take the above effect into account.
However, it is most important that the volume was extremely big – not that it broke a few records. History tends to repeat itself, so the key question is what silver did after previous sessions when it traded on huge volume.
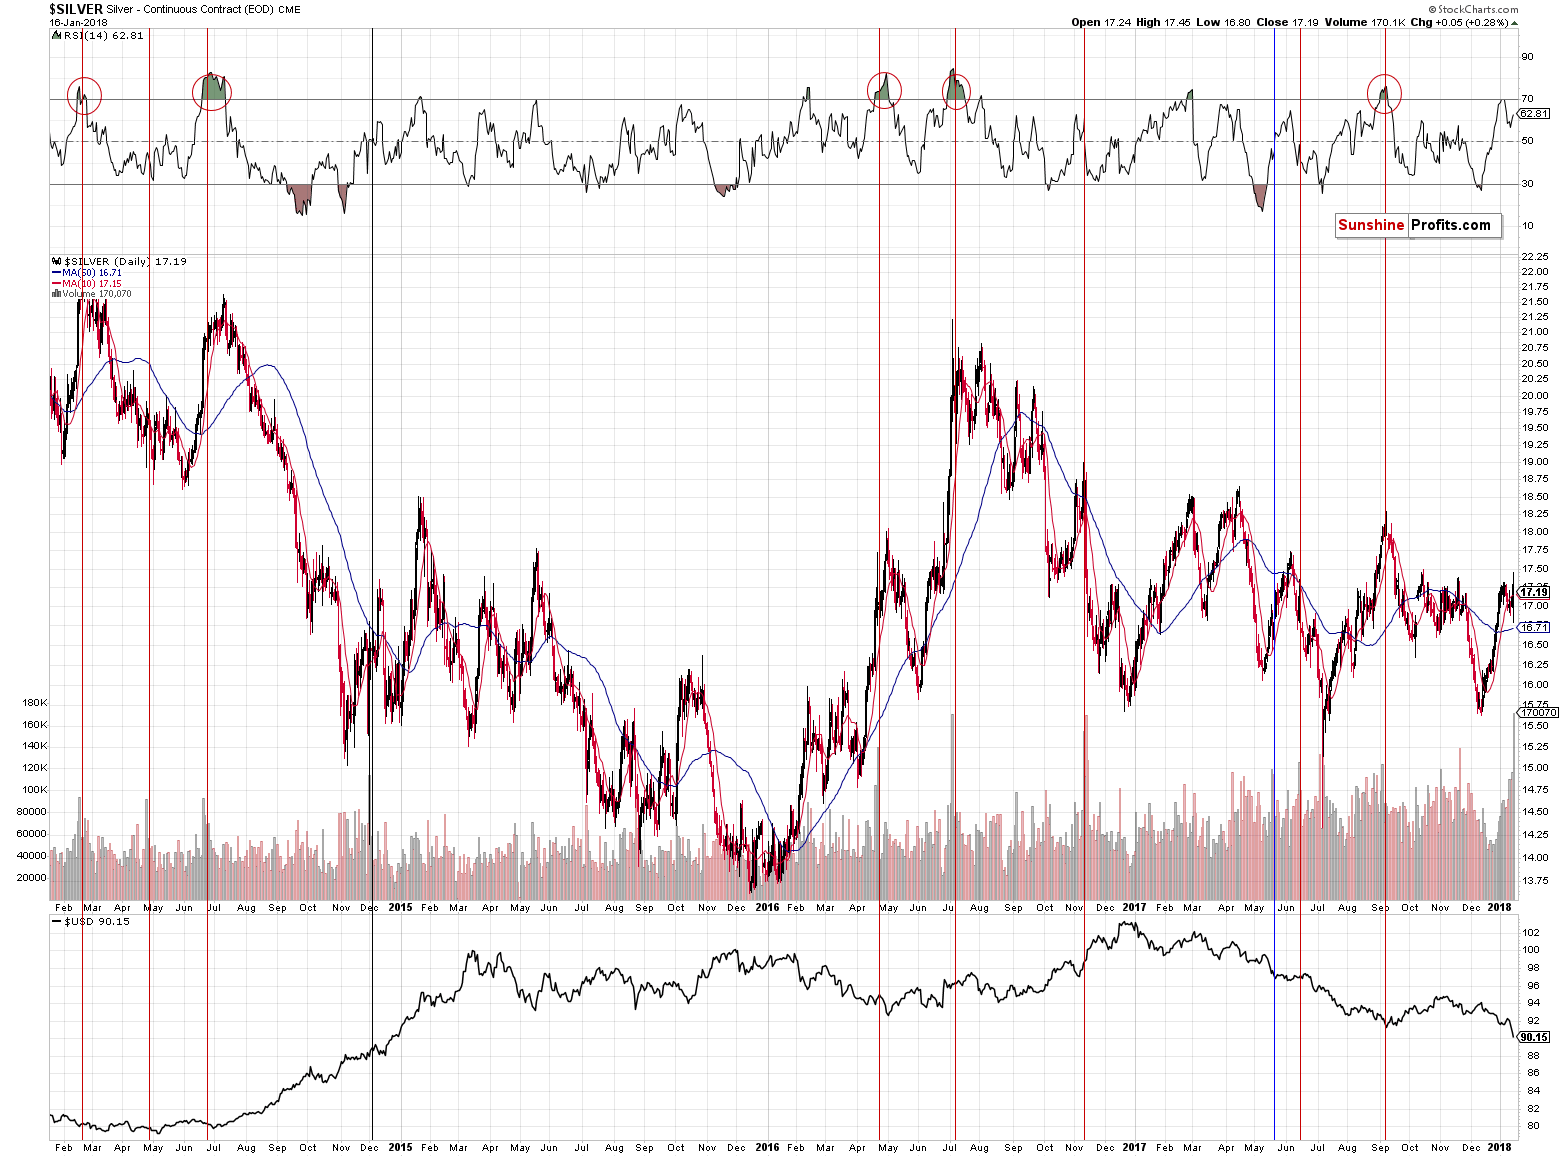
It usually declined. We marked the similar sessions with vertical lines and we used the red color for the cases when a bigger decline followed either immediately or shortly. The black line represents the session that was not followed by anything specific and the blue session was followed by higher silver prices in the short term.
Thered sessions dominate, which makes the current session bearish. However, what makes it very bearish is considering the above together with the RSI indicator. The latter shows the status of the market when the huge-volume upswing was seen.
Whenever silver moved higher on huge volume when the RSI was above 60, it meant that a top was in or at hand. We marked those situations with red ellipses. The RSI closed at 62 yesterday, which makes the current combination of signals very bearish.
Has silver topped based the extreme volume reading? It could be the case, but this is not what the above chart is saying. It’s saying that a big decline is just around the corner and paying a lot of attention to bullish signs might be misleading.
Summing up, there are some bullish signs that catch the gold investor’s eye (the gold stocks’ rally) and we discuss them thoroughly in today’s alert, but they should not be taken at their face value. Silver’s extreme volume reading is not something that should be ignored and it paints a quite bearish picture for the following weeks.
Want free follow-ups to the above article and details not available to 99%+ investors? Sign up to our free newsletter today!
Author

Przemyslaw Radomski, CFA
Sunshine Profits
Przemyslaw Radomski, CFA (PR) is a precious metals investor and analyst who takes advantage of the emotionality on the markets, and invites you to do the same. His company, Sunshine Profits, publishes analytical software that any


