Silver: Triangular pattern may drive to a bullish breakout

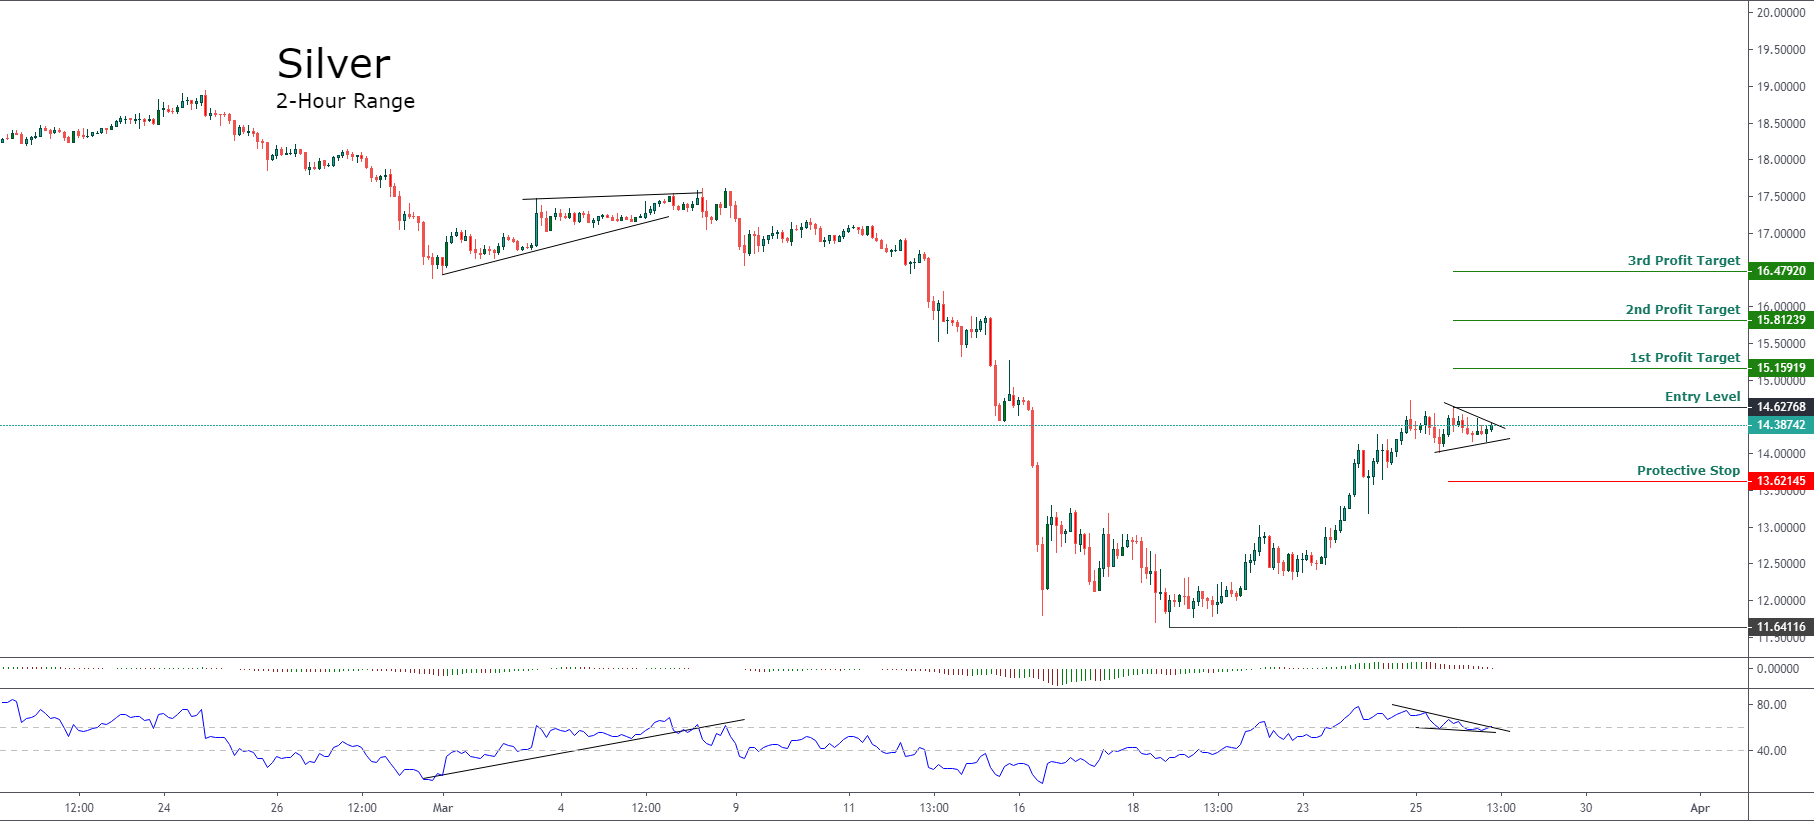
Silver, in its 2-hour chart, reveals its price consolidation as a triangle formation after the rally developed by the precious metal that started from its July 2009 bottom.
According to chartist analysis, the triangle pattern is a consolidation formation, which, usually, is followed by the continuation of the previous upward movement. In this case, that move began on March 18th, 2020, when the price bottomed to $11.641 per ounce. Also, we can see that The RSI oscillator has moved above 60, and currently, it is close to the 80 level. This context makes us recognize that the short-term bias remains in the bullish side.
The bullish breakout above $14.62 per ounce, could boost the precious metal to $15.81 as a potential first target. If Silver extends its gains, the price could advance toward $15.81, and even climb until $16.47 per ounce.
The level that invalidates our bullish continuation scenario locates at $13.62 per ounce.
Trading Plan Summary
-
Entry Level: $14.62
-
Protective Stop: $13.62
-
1st Profit Target: $15.15
-
2nd Profit Target: $15.81
-
3rd Profit Target: $16.47
Author

EagleFX Team
EagleFX
EagleFX Team is an international group of market analysts with skills in fundamental and technical analysis, applying several methods to assess the state and likelihood of price movements on Forex, Commodities, Indices, Metals and


