Silver just broke through the crucial $30 resistance: Will it be a top performing asset this year?

Last Week, gold, the S&P 500, NASDAQ all form new peaks, but the most eye-catching is the silver, in one week silver surged 11.47%, making the silver performance even out-perform gold this year.
So will silver continue the uptrend and good performance?
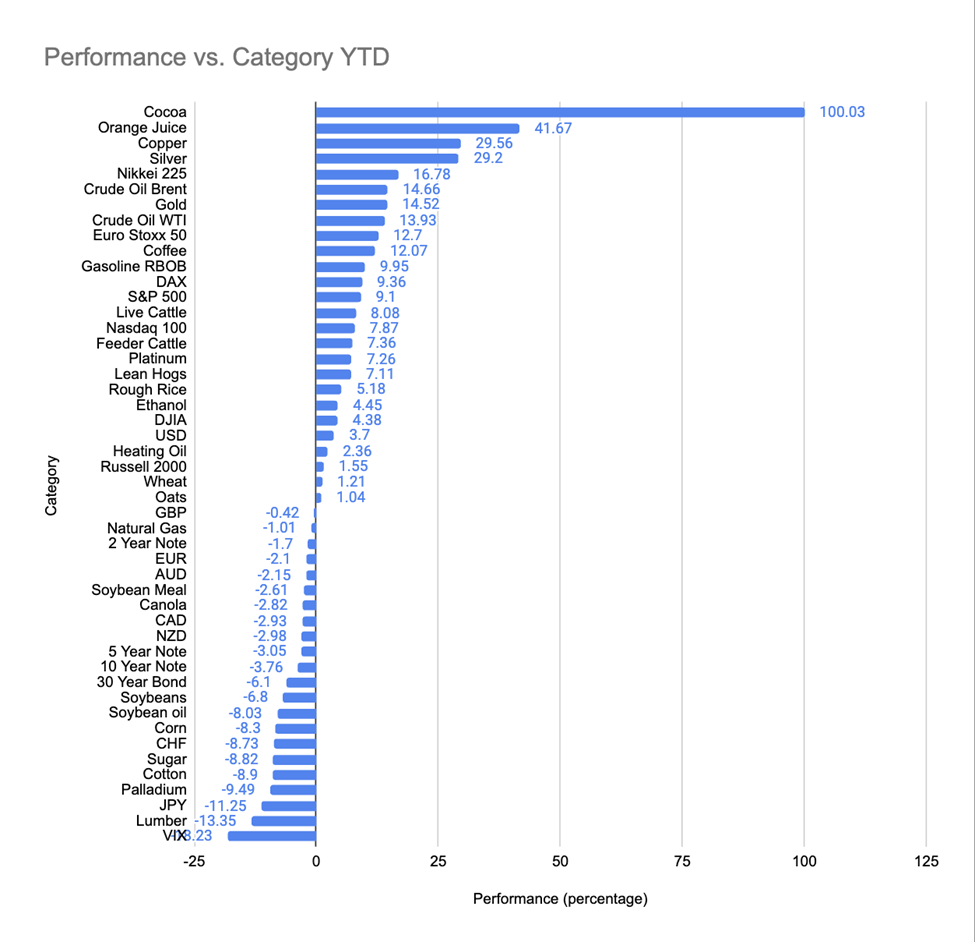
Source: FINVIZ
Physical investment in silver experienced a substantial decline last year, falling by nearly a third to a three-year low of 243.1 million ounces (7,562 tonnes). However, since 2021, there has been a notable increase in silver usage across various industries, including AI chips, solar panels, and electric vehicles. This surge in industrial demand has caused silver consumption to exceed supply by approximately 20%.
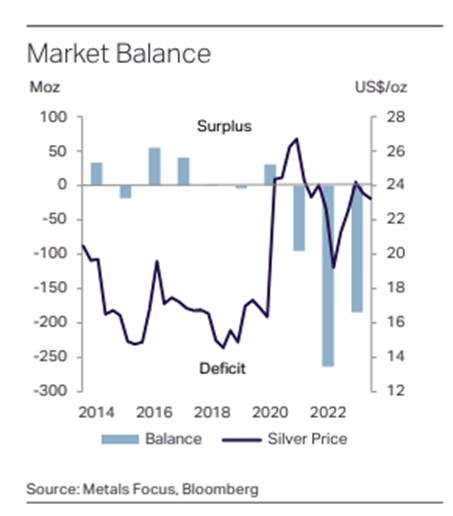
Source: Silver Institute
In 2010, investors filed a lawsuit against JPMorgan Chase & Co and HSBC Holdings Plc, accusing them of colluding to manipulate silver prices. However, in 2014, a 2nd Circuit Court panel found insufficient evidence to prove that JPMorgan's extensive and seemingly irrational short positions were intended for market manipulation or that they conspired with brokers. While the court acknowledged JPMorgan's substantial short position, it emphasised that this alone did not demonstrate an intent to manipulate the market. The ruling confirmed that JPMorgan held a significant quantity of short positions. Together, JPMorgan and HSBC controlled over 48% of the short positions in the futures market, indicating a significant concentration of short positions among a few banks. This concentration had the potential to intensify upward price pressure on silver, leading to a short squeeze.
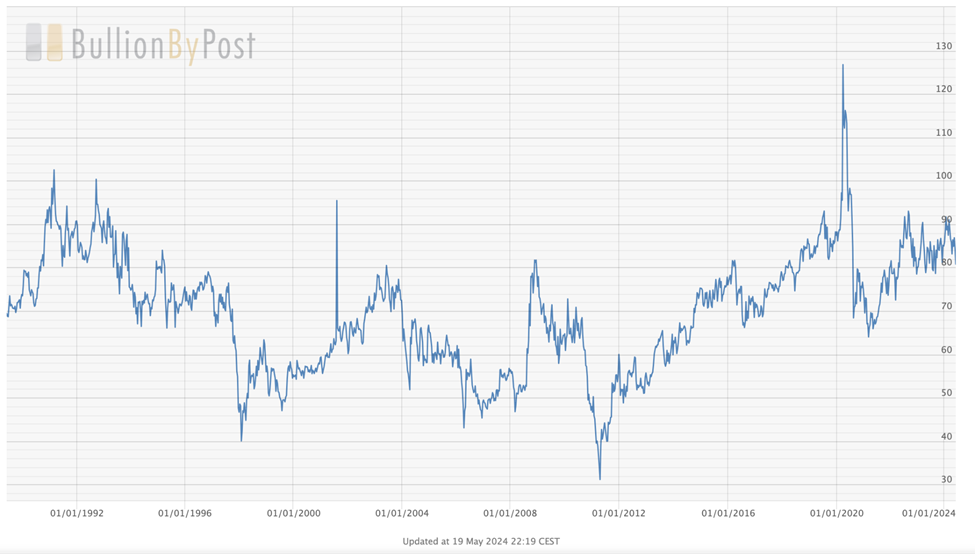
Source: BullionByPost
Over the past 35 years, the gold/silver ratio has typically ranged between 50 and 80. Since 2016, gold has outperformed silver. However, with silver showing better performance than gold year-to-date, 2024 might be the year silver outperforms gold.
Last Friday, gold closed at 2417. If the gold/silver ratio is 80, silver should be priced at 30.21. If the ratio is 50, silver should be priced at 48.34. This suggests that silver has significant upside potential.
Technical analysis
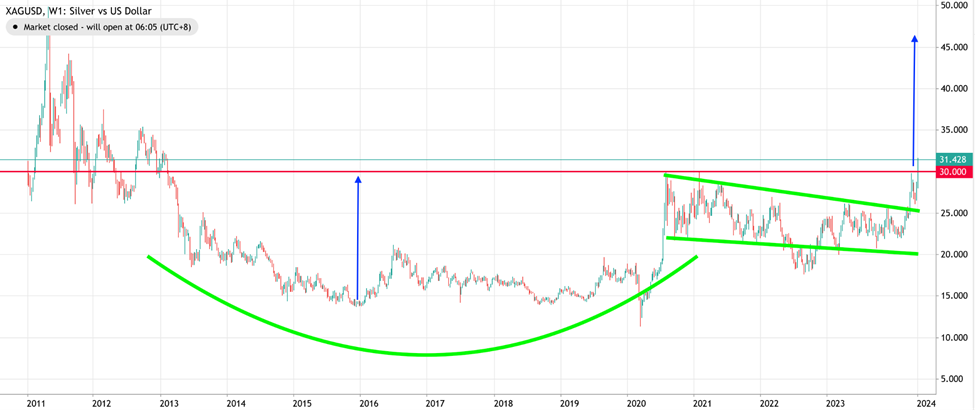
Source: deriv MT5
The weekly chart of silver has formed a cup and handle pattern and is now breaking through the major resistance level of $30, which has held since 2020. The measured target for this pattern is around $46-$48, aligning with the target calculated using the gold/silver ratio discussed earlier.
Monetary policies are also influencing the market, with the People's Bank of China (PBOC) and the European Central Bank (ECB) loosening their policies, the Federal Reserve (Fed) slowing the pace of quantitative tightening (QT), and increased investment demand as prices surge.
Author

Prakash Bhudia
Deriv
Prakash Bhudia, HOD – Product & Growth at Deriv, provides strategic leadership across crucial trading functions, including operations, risk management, and main marketing channels.


