Silver Elliott Wave technical analysis [Video]
![Silver Elliott Wave technical analysis [Video]](https://editorial.fxsstatic.com/images/i/Commodities_Silver-2_XtraLarge.jpg)
Silver Elliott Wave analysis
After gaining 12% since late January, Silver has been retracing the 5-wave impulse sequence since 19th December. However, the path still favors the upside as buyers await the next price levels to buy from.
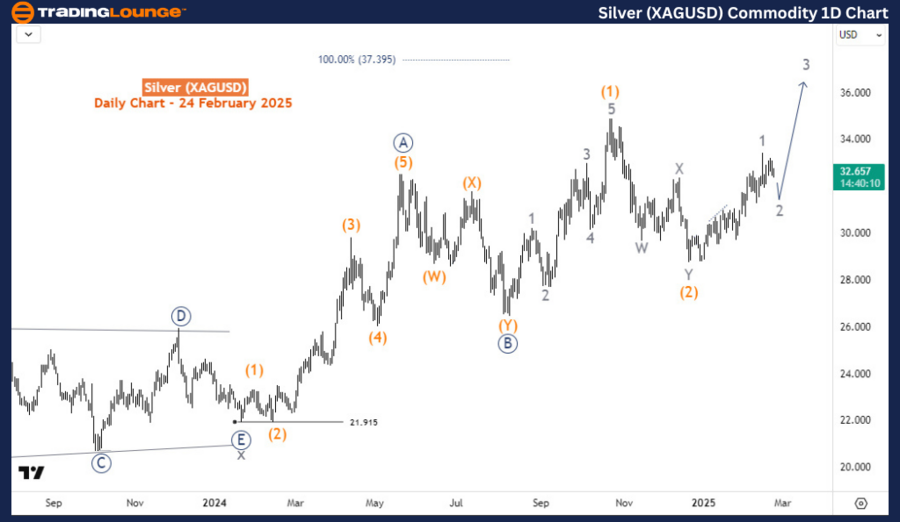
SIlver daily chart analysis
On the daily chart, the price completed the wave (2) of a long-term proposed impulse sequence from the low of August 2024. Wave (2) finished at $28.7 where the current resurgence started from. From this low, it appears an impulse structure for wave 1 of (3) has finished and the price is correcting it in wave 2. Looking at the bigger bullish cycle from the 21.915 low, we expect at least an ((A))-((B))-((C)) or ((1))-((2))-((3))-((4))-((5)) sequences. This shows that the upside is still a long way to go. Thus, buying pullbacks should continue to interest traders.
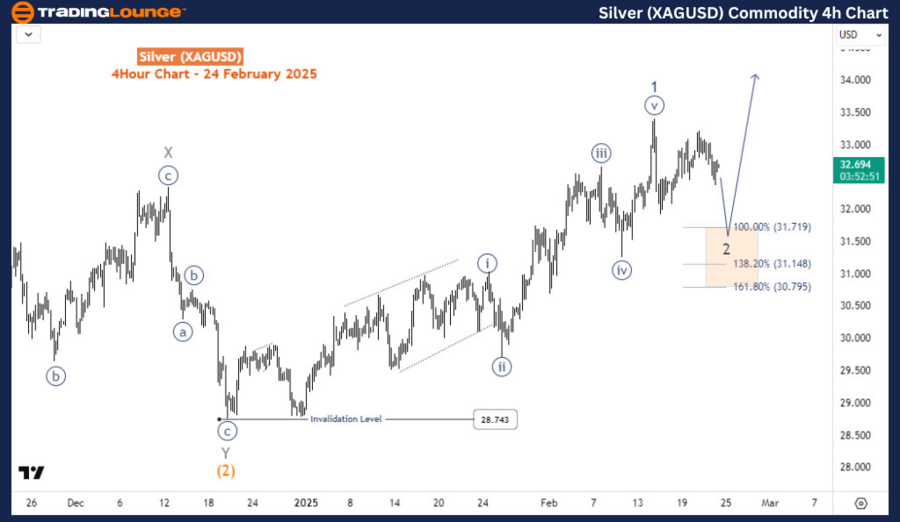
Silver H4 chart analysis
From the H4 chart, wave 2 could either evolve as a zigzag or double zigzag structure. If it’s a zigzag, then it should find support at the 31.719-30.795 Fibonacci zone where wave 3 should begin and lead to higher prices. Alternatively, if the response off this zone is corrective, then wave 3 could extend much lower in a double correction but should find support above the 28.743 low and attract buyers.
Technical analyst: Sanmi Adeagbo.
Silver Elliott Wave analysis [Video]
Author

Peter Mathers
TradingLounge
Peter Mathers started actively trading in 1982. He began his career at Hoei and Shoin, a Japanese futures trading company.


