Silver Elliott Wave technical analysis [Video]
![Silver Elliott Wave technical analysis [Video]](https://editorial.fxstreet.com/images/Markets/Commodities/Metals/Silver/sterling-silver-46984604_XtraLarge.jpg)
Silver Elliott Wave analysis
Shortly after reaching a new high for the year, Silver is pulling back. The bearish correction was majorly supported by a bullish dollar. However, this pullback is expected to finish above the 07-August low while buyers push further upside.
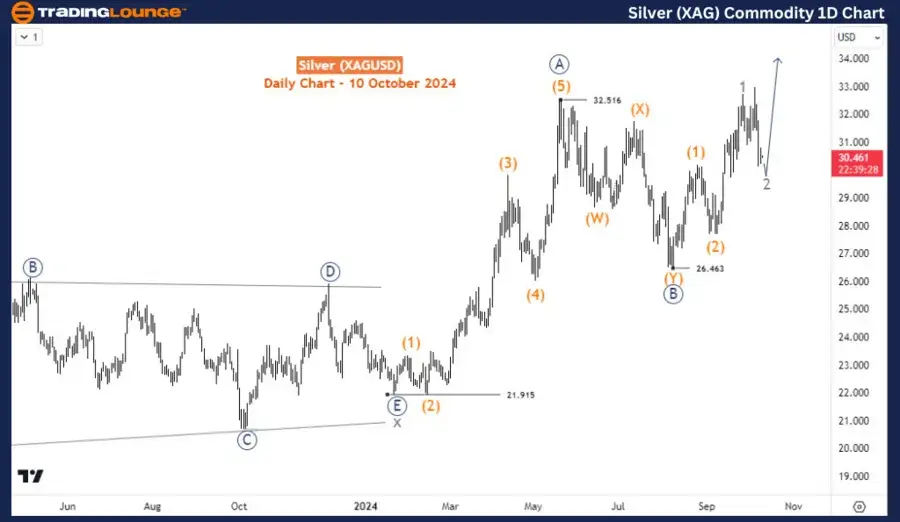
On the daily chart, we labeled as wave ((A)) the bullish impulse wave sequence that started in January 2024 and ended at $32.5 in May 2024. Price corrected the pullback in a double zigzag structure that lasted for 11 weeks before the current resurgence began. Thus, the structure from January 2024 could either be a 1-2-3 wave sequence of an impulse or an A-B-C wave sequence in a zigzag. The former has a target for the 3rd leg above 41.5 while the latter has it within 37.38-41.49. However, in either case, the upside is well supported. From the 26.46 low of August, the daily chart shows the development of the 3rd wave. It appears the price is in wave 2 of (3) of ((C))/((3)).
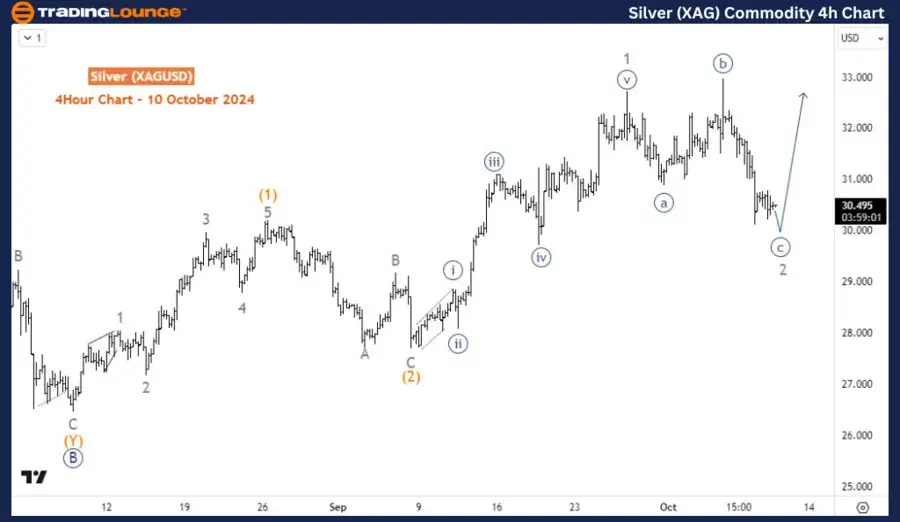
On the H4 chart, it appears wave 2 is completing an expanding flat structure. However, flats can be tricky. Thus, a break above wave ((b)) is needed to confirm wave 3. On the other hand, wave 2 could still complete a zigzag structure. In either scenario, provided the low of September 2024 is not breached, the upside is favored in wave 3 of (3).
Technical analyst: Sanmi Adeagbo.
Silver Elliott Wave analysis [Video]
Author

Peter Mathers
TradingLounge
Peter Mathers started actively trading in 1982. He began his career at Hoei and Shoin, a Japanese futures trading company.


