Sideways market equals a mixed day

USD: Dec '25 is Up at 98.085.
Energies: Nov '25 Crude is Down at 61.61.
Financials: The Dec '25 30 Year T-Bond is Lower by 1 tick and trading at 116.07.
Indices: The Sep '25 S&P 500 emini ES contract is 11 ticks Lower and trading at 6786.00.
Gold: The Dec'25 Gold contract is trading Up at 3982.10.
Initial conclusion
This is not a correlated market. The USD is Up and Crude is Down which is normal, and the 30 Year T-Bond is trading Lower. The Financials should always correlate with the US dollar such that if the dollar is Higher, then the bonds should follow and vice-versa. The S&P is Lower and Crude is trading Lower which is not correlated. Gold is trading Higher which is not correlated with the US dollar trading Up. I tend to believe that Gold has an inverse relationship with the US Dollar as when the US Dollar is down, Gold tends to rise in value and vice-versa. Think of it as a seesaw, when one is up the other should be down. I point this out to you to make you aware that when we don't have a correlated market, it means something is wrong. As traders you need to be aware of this and proceed with your eyes wide open. Asia traded Mixed. Europe is trading Higher.
Possible Challenges to Traders
-
Trade Balance is tentative. This is Major.
-
FOMC Member Bostic Speaks at 10 AM EST. This is Major.
-
FOMC Member Bowman Speaks at 10:05 AM EST. Major.
-
RCM/TIPP Economic Optimism is tentative. This is Major.
-
FOMC Member Miran Speaks at 10:45 AM EST. Major.
-
FOMC Member Kashkari Speaks at 11:30 AM EST. Major.
-
Consumer Credit m/m is out at 3 PM EST. Major.
Traders, please note that we've changed the Bond instrument from the 10 Year (ZN) to the 2 Year (ZT). They work exactly the same.
We've elected to switch gears a bit and show correlation between the 2-year Treasury notes (ZT) and the S&P futures contract. The YM contract is the Dow Jones Industrial Average, and the purpose is to show reverse correlation between the two instruments. Remember it's likened to a seesaw, when up goes up the other should go down and vice versa.
Yesterday the ZT charged Higher at around 8:30 AM EST with no other economic news in sight. The Dow dived Lower at the same time. Look at the charts below and you'll see a pattern for both assets. The Dow dived Lower at around 8:30 AM EST and the ZT climbed Higher at around the same time. These charts represent the newest version of Bar Charts, and I've changed the timeframe to a 15-minute chart to display better. This represented a Long opportunity on the 2-year note, as a trader you could have netted about a dozen plus ticks per contract on this trade. Each tick is worth $6.25. Please note: the front month for ZT is now Dec '25 and the Dow is now Dec '25. I've changed the format to filled Candlesticks (not hollow) such that it may be more apparent and visible.
Charts courtesy of BarCharts
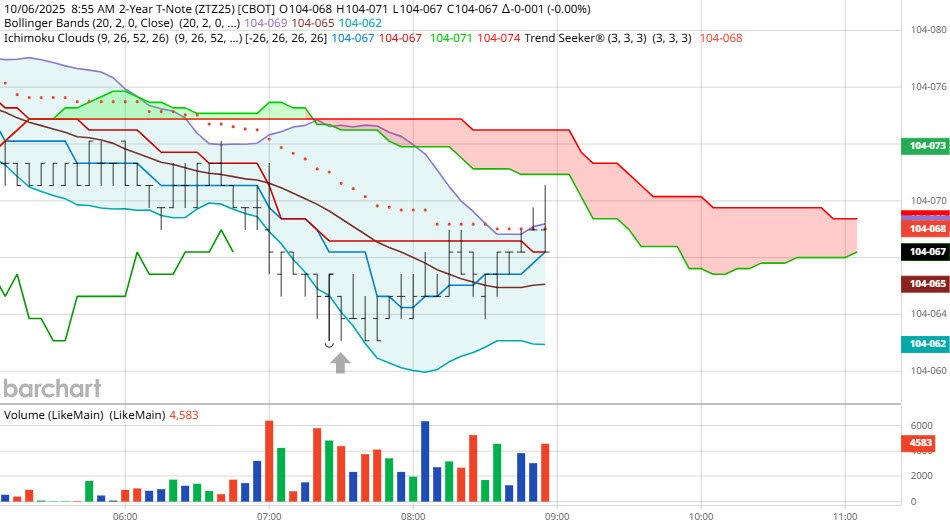
ZT -Sep 25 - 10/06/25
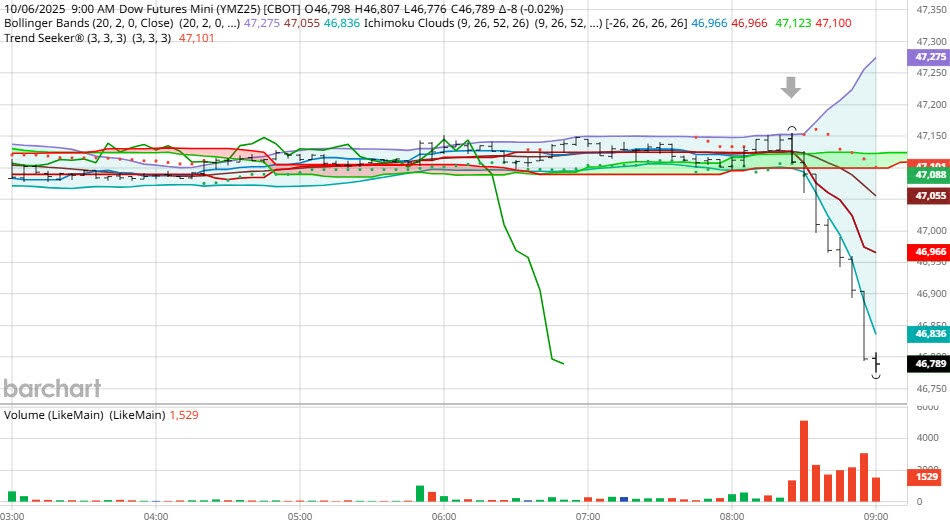
Dow - Sep 2025- 10/06/25
Bias
Yesterday we gave the markets a Mixed day and the markets didn't disappoint. The Dow dropped by 63 points, but the other indices closed in positive territory. All in all, a Neutral or Mixed day. Today we aren't dealing with a correlated market and our bias is to the Downside.
Could this change? Of Course. Remember anything can happen in a volatile market.
Commentary
I'm starting to see a number of economic reports that are listed as "tentative" when it comes to the time frame of their release. I wonder if this is because the Bureau of Labor Statistics is shut down due to the government. This is pure speculation on my part, but it wouldn't surprise me. Whether this is true or not is yet to be seen. Want to learn Market Correlation and determine market direction hours before the Opening Bell?
Author

Nick Mastrandrea
Market Tea Leaves


