US Dollar: Mar. USD is Up at 90.350.

Energies: Mar ’18 Crude is Up at 63.82.

Financials: The Mar 30 year bond is Up 22 ticks and trading at 149.11.

Indices: The Mar S&P 500 emini ES contract is 18 ticks Higher and trading at 2839.75.

Gold: The Feb gold contract is trading Up at 1336.40.  Gold is 45 ticks Higher than its close.

Initial Conclusion

This is not a correlated market.  The dollar is Up+ and Crude is Up+  which is not normal and the 30 year Bond is trading Higher.  The Financials should always correlate with the US dollar such that if the dollar is lower then bonds should follow and vice-versa. The S&P is Higher and Crude is trading Up+ which is not correlated. Gold is trading Up+ which is not correlated with the US dollar trading Up.   I tend to believe that Gold has an inverse relationship with the US Dollar as when the US Dollar is down, Gold tends to rise in value and vice-versa. Think of it as a seesaw, when one is up the other should be down. I point this out to you to make you aware that when we don’t have a correlated market, it means something is wrong. As traders you need to be aware of this and proceed with your eyes wide open.

At this hour all of Asia is trading mainly Higher.  As of this writing Europe is trading Higher as well.

Possible Challenges To Traders Today

  • Richmond Manufacturing Index is out at 10 AM EST.  This is major.

  • Lack of major economic news.

Treasuries

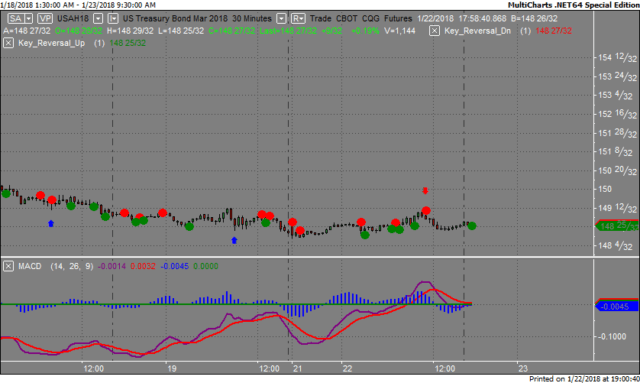
We’ve elected to switch gears a bit and show correlation between the 30 year bond (ZB) and The YM futures contract.  The YM contract is the DJIA and the purpose is to show reverse correlation between the two instruments.  Remember it’s liken to a seesaw, when up goes up the other should go down and vice versa.

Yesterday the ZB made it’s move at around 11 AM EST.   The ZB hit a High at around that time and the YM hit a Low.  If you look at the charts below ZB gave a signal at around 11 AM EST and the YM was moving Higher at the same time. Look at the charts below and you’ll see a pattern for both assets. ZB hit a High at around 11 AM and the YM hit a Low.  These charts represent the newest version of MultiCharts and I’ve changed the timeframe to a 30 minute chart to display better.  This represented a shorting  opportunity on the 30 year bond, as a trader you could have netted about 20 ticks per contract on this trade.  Each tick is worth $31.25.

Charts Courtesy of MultiCharts built on an AMP platform.

ZB


YM

Bias

Yesterday we gave the markets a Neutral bias as there wasn’t any correlation amongst the various instruments that we track.  The markets however did advance with the Dow gaining 143 points and the other indices gaining ground as well.  Today we aren’t dealing with a correlated market however we will maintain a neutral bias.

Could this change? Of Course.  Remember anything can happen in a volatile market. 

Commentary

Yesterday we gave the markets a neutral bias which means the markets could go in any direction and often does.  The markets opened in negative territory but it was announced that an accord had been struck between the GOP and Democratic members of Congress that changed everything and the markets moved into positive territory.  Understand that this measure is only a stop gap that will fund the US government until February 8th.

Trading performance displayed herein is hypothetical. The following Commodity Futures Trading Commission (CFTC) disclaimer should be noted.

Hypothetical performance results have many inherent limitations, some of which are described below. No representation is being made that any account will or is likely to achieve profits or losses similar to those shown.

In fact, there are frequently sharp differences between hypothetical performance results and the actual results subsequently achieved by any particular trading program. One of the limitations of hypothetical performance trading results is that they are generally prepared with the benefit of hindsight.

In addition, hypothetical trading does not involve financial risk, and no hypothetical trading record can completely account for the impact of financial risk in actual trading. For example, the ability to withstand losses or to adhere to a particular trading program in spite of trading losses are material points which can also adversely affect actual trading results.

There are numerous other factors related to the markets in general or to the implementation of any specific trading program which cannot be fully accounted for in the preparation of hypothetical performance results and all of which can adversely affect actual trading results.

Trading in the commodities markets involves substantial risk and YOU CAN LOSE A LOT OF MONEY, and thus is not appropriate for everyone. You should carefully consider your financial condition before trading in these markets, and only risk capital should be used.

In addition, these markets are often liquid, making it difficult to execute orders at desired prices. Also, during periods of extreme volatility, trading in these markets may be halted due to so-called “circuit breakers” put in place by the CME to alleviate such volatility. In the event of a trading halt, it may be difficult or impossible to exit a losing position.

Recommended Content


Recommended Content

Editors’ Picks

AUD/USD holds higher ground above 0.6450 on risk-on mood

AUD/USD holds higher ground above 0.6450 on risk-on mood

AUD/USD is holding higher ground above 0.6450 in the Asian session on Tuesday. The pair capitalizes on the extended risk-on flows into Asia from Wall Street overnight. Upbeat Australian Composite PMI also supports the Aussie ahead of US PMI data. 

AUD/USD News

USD/JPY: Japanese Yen bounces off multi-decade low against USD, lacks follow-through

USD/JPY: Japanese Yen bounces off multi-decade low against USD, lacks follow-through

The Japanese Yen draws some support from the possibility of a government intervention. The divergent BoJ-Fed expectations and easing Middle East tensions cap the safe-haven JPY. Traders also seem reluctant ahead of the key US macro data and BoJ meeting later this week.

USD/JPY News

Gold price drops to over two-week low, flirts with $2,300 amid easing Middle East worries

Gold price drops to over two-week low, flirts with $2,300 amid easing Middle East worries

Gold price drifts lower for the second successive day amid receding geopolitical tensions. Reduced Fed rate cut bets continue to underpin the USD and contribute to the downfall. The fundamental backdrop warrants some caution before placing aggressive bearish bets.

Gold News

Ethereum could see a brief rally, Justin Sun suspected of buying heavily

Ethereum could see a brief rally, Justin Sun suspected of buying heavily

Ethereum's recent price movement hints at a potential rally despite ETH ETPs recording outflows. The recent price improvement follows the fourth Bitcoin halving and a suspected Justin Sun wallet purchasing large numbers of ETH.

Read more

After Monday's relief rally, attention shifts to earnings and policy fronts

After Monday's relief rally, attention shifts to earnings and policy fronts

With the easing of tensions in the Middle East, safe-haven demand reversed course; global stock markets experienced a modicum of relief. Indeed, in a classic relief rally fashion, Monday saw a rebound in the S&P 500, snapping a six-day losing streak.

Read more

Majors

Cryptocurrencies

Signatures