Senate Delays, Markets Suffer

Good Morning Traders,
As of this writing 4 AM EST, here’s what we see:
US Dollar: Sept. USD is Down at 95.945.
Energies: Aug Crude is Down at 43.89.
Financials: The Sept 30 year bond is Down 25 ticks and trading at 154.29.
Indices: The Sept S&P 500 emini ES contract is 12 ticks Lower and trading at 2417.50.
Gold: The Aug gold contract is trading Up at 1251.30. Gold is 44 ticks Higher than its close.
Initial Conclusion
This is not a correlated market. The dollar is Down- and Crude is Down- which is not normal and the 30 year Bond is trading Lower. The Financials should always correlate with the US dollar such that if the dollar is lower then bonds should follow and vice-versa. The indices are Down and Crude is trading Down- which is not correlated. Gold is trading Up+ which is correlated with the US dollar trading Down-. I tend to believe that Gold has an inverse relationship with the US Dollar as when the US Dollar is down, Gold tends to rise in value and vice-versa. Think of it as a seesaw, when one is up the other should be down. I point this out to you to make you aware that when we don’t have a correlated market, it means something is wrong. As traders you need to be aware of this and proceed with your eyes wide open.
At this hour all of Asia is trading Lower. All of Europe is trading Lower at this hour as well.
Possible Challenges To Traders Today
– Goods Trade Balance is out at 8:30 AM EST. This is major.
– Prelim Wholesale Inventories is out at 8:30 AM. This is major.
– Pending Home Sales m/m is out at 10 AM. This is major.
– Crude Oil Inventories is out at 10:30 AM EST. This is major.
Treasuries
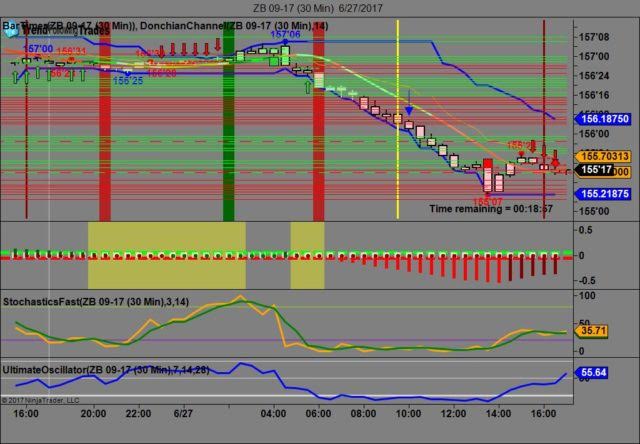
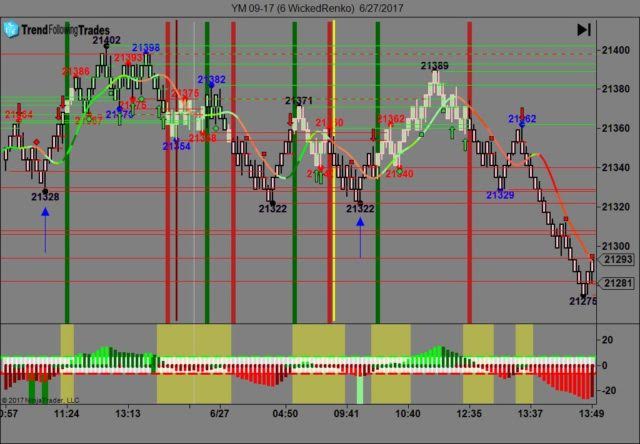
We’ve elected to switch gears a bit and show correlation between the 30 year bond (ZB) and The YM futures contract. The YM contract is the DJIA and the purpose is to show reverse correlation between the two instruments. Remember it’s liken to a seesaw, when up goes up the other should go down and vice versa.
Yesterday the ZB made it’s move at around 10 AM EST before the FOMC members spoke. The ZB hit a high at around that time and the YM hit a low. If you look at the charts below YM gave a signal at around 10 AM and the ZB was moving Lower at the same time. Look at the charts below and you’ll see a pattern for both assets. YM hit a low at around 10 AM and the ZB hit a high. These charts represent the newest version of Trend Following Trades and I’ve changed the timeframe to a 30 minute chart to display better. This represented a shorting opportunity on the 30 year bond, as a trader you could have netted about 30 plus ticks per contract on this trade. Each tick is worth $31.25. We added a Donchian Channel to the charts to show the signals more clearly. Please note that the front month for the ZB contract is now September, 2017.
Charts Courtesy of Trend Following Trades built on a NinjaTrader platform.
Bias
Yesterday we gave the markets a downside bias as the Bonds and Gold were both trading higher yesterday morning. This usually indicates a downside day. The Dow dropped 99 points and the other indices fell as well. Today we aren’t dealing with a correlated market and our bias is neutral.
Could this change? Of Course. Remember anything can happen in a volatile market.
Commentary
Yesterday we gave the markets a downside bias and all we did was to follow our rules of Market Correlation which told us as early as 4 AM EST that the markets would probably fall and they did. The HPI number didn’t help much as it fell and the news that the Senate would delay the HealthCare bill didn’t help matters either. Don’t get us wrong, we are not in favor of a bill that will throw 22 million Americans off healthcare but the Smart Money is. Why? Because they believe that Trump won’t get any of his tax cuts unless Obamacare is repealed. The Senate GOP in the meantime know they won’t have enough votes to get this “bill” passed even if they use the nuclear option (have Mike Pence cast a vote). Why? Because even the most staunchest Republican will have a hard time getting re-elected if they vote in favor of this bill. Interesting dilemma but as in all things, time will tell.
Author

Nick Mastrandrea
Market Tea Leaves


