Sell-off in October, Just Seasonality?

Investors were selling stocks in panic yesterday, following breaking down below the support level of the late January local high. The S&P 500 index has retraced its three-month-long advance in one day, and it fell below the level of 2,800. Will this sell-off continue today?
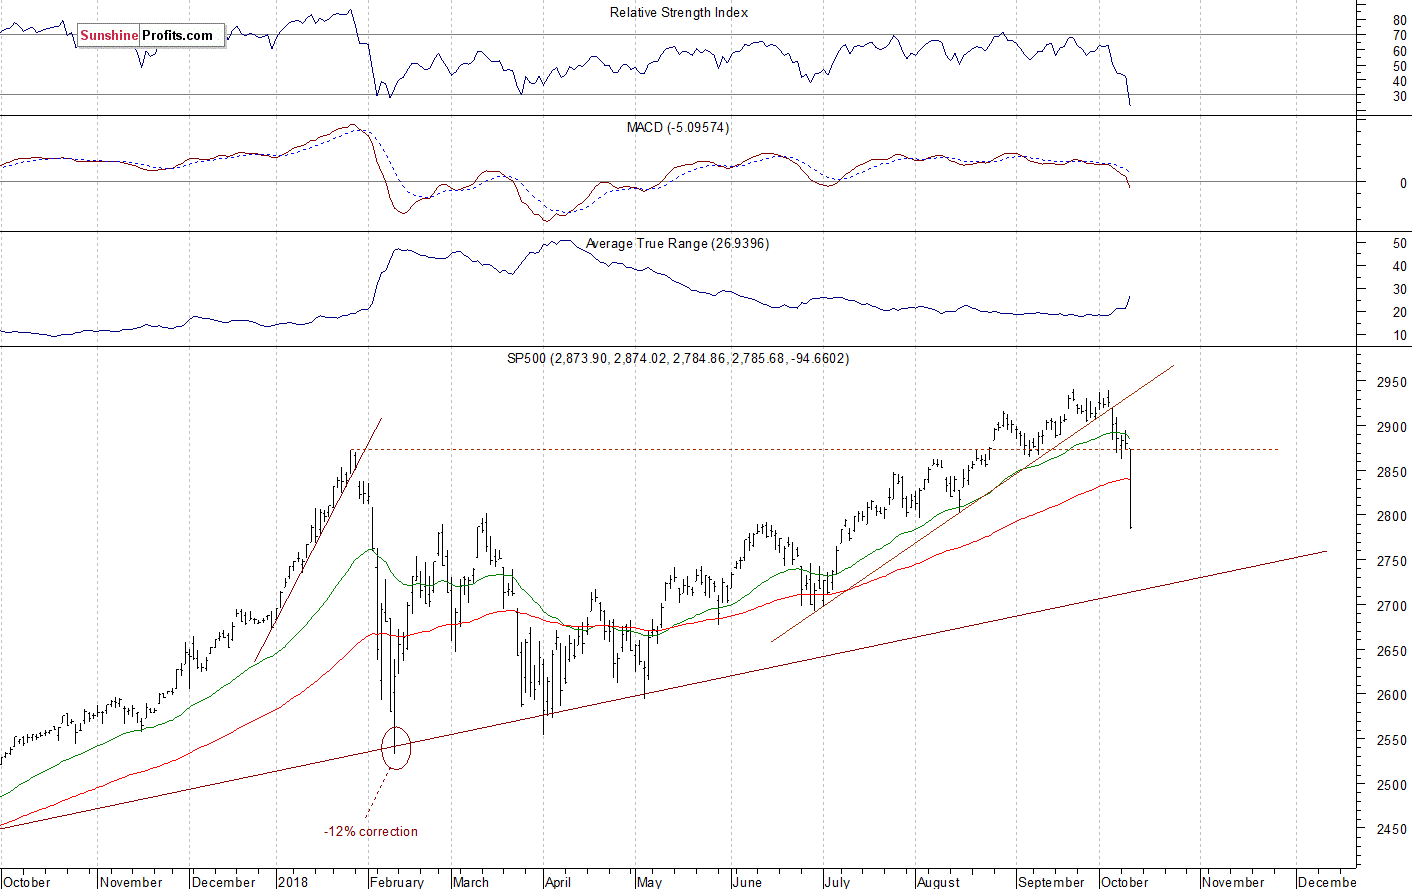
The U.S. stock market indexes lost 3.2-4.1% on Wednesday, retracing their months-long advances, as the recent downtrend accelerated following a breakdown below the medium-term support level. The S&P 500 index broke below the level of 2,800. It currently trades 5.3% below September the 21st record high of 2,940.91. The Dow Jones Industrial Average lost 3.2% and the Nasdaq Composite lost 4.1% yesterday.
The nearest important level of resistance of the S&P 500 index is now at around 2,800, marked by the July-August local lows. The resistance level is also at 2,825-2,830, marked by August the 16th daily gap up of 2,827.95-2,831.44. On the other hand, a potential support level is at around 2,765, marked by July the 9th daily gap up of 2,764.41-2,768.51. The next support level is at 2,730-2,750, marked by some late June - early July fluctuations.
The broad stock market retraced its three-month-long advance yesterday, as the S&P 500 index fell more than 3% in one day. Will this sell-off continue? We may see another lower opening of the trading session, but stocks may bounce at some point. The index is still above its long-term upward trend line. That trend line is currently at around 2,720, as we can see on the daily chart:
Negative Expectations Again
Expectations before the opening of today's trading session are negative, because the index futures contracts trade between -0.7% and -0.9% vs. their yesterday's closing prices. The European stock market indexes have lost 1.5-1.6% so far. Investors will wait for some economic data announcements today: Initial Claims, Consumer Price Index at 8:30 a.m., Crude Oil Inventories at 11:00 a.m. The broad stock market will likely extend its yesterday's sell-off today, but we may see an attempt at bouncing off the mentioned support levels. There have been no confirmed positive signals so far. However, we can see some short-term oversold conditions.
The S&P 500 futures contract trades within an intraday consolidation following an overnight decline. The nearest important level of resistance is now at around 2,780, marked by the short-term local highs. The resistance level is also at 2,800. On the other hand, the support level is at 2,745-2,750, marked by the local lows. The next level of support is at 2,700-2,720, among others. The futures contract keeps bouncing off the level of 2,750, as the 15-minute chart shows:
Nasdaq Below 7,000 Mark
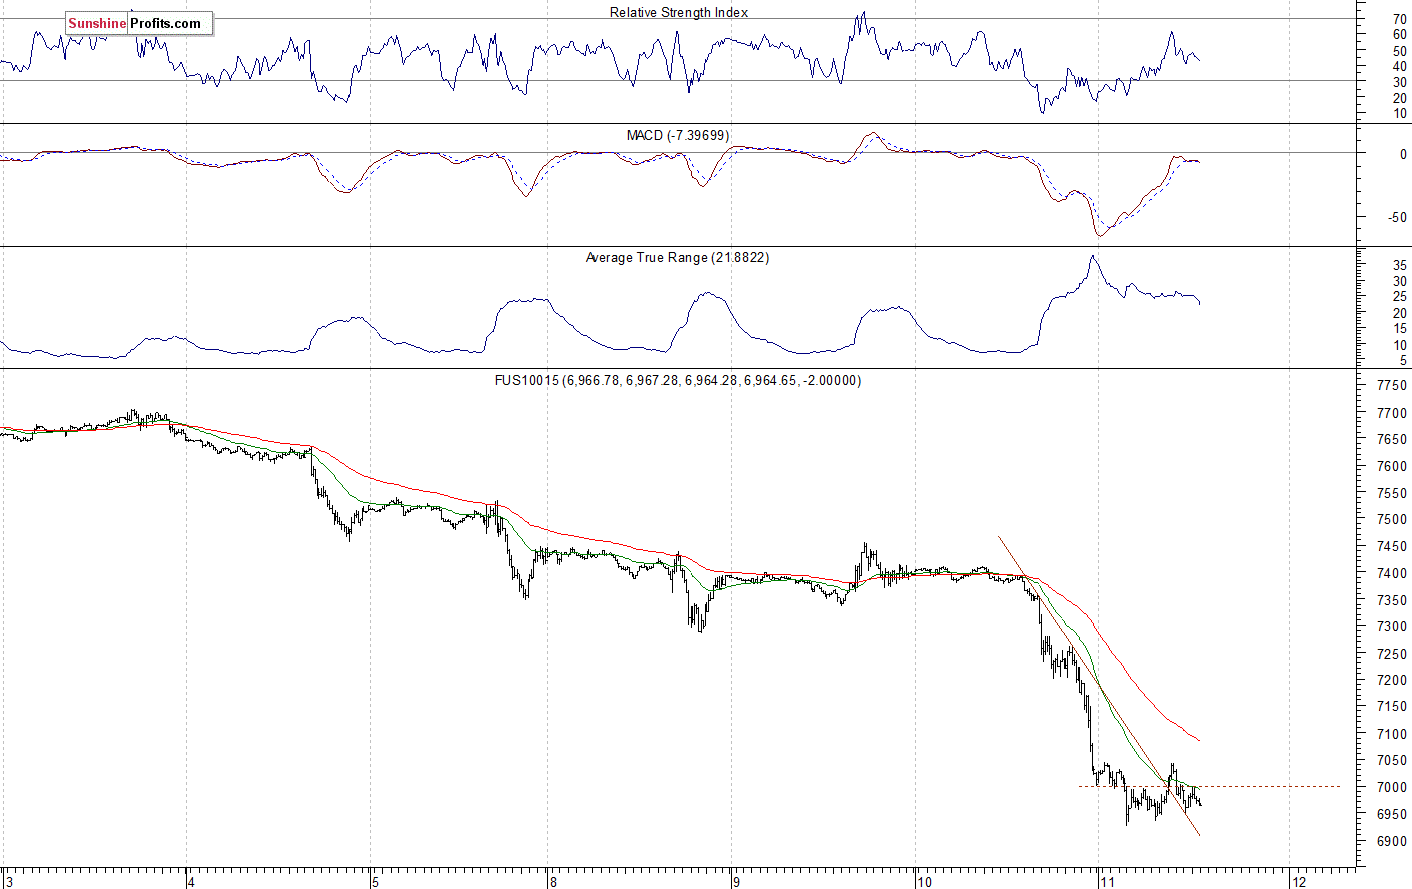
The technology Nasdaq 100 futures contract follows a similar path, as it trades within an intraday consolidation following an overnight decline. The tech stocks' gauge remains relatively weaker than the broad stock market. It broke below the level of 7,300 on Monday, as it fell the lowest since the late August. Then it broke below 7,000 mark today. The nearest important support level is now at around 6,900-6,950, marked by the local lows. On the other hand, the resistance level is now at 7,000, among others. The Nasdaq futures contract trades along the level of 7,000 this morning, as we can see on the 15-minute chart:
Amazon Leading the Decline, Apple at Support Level
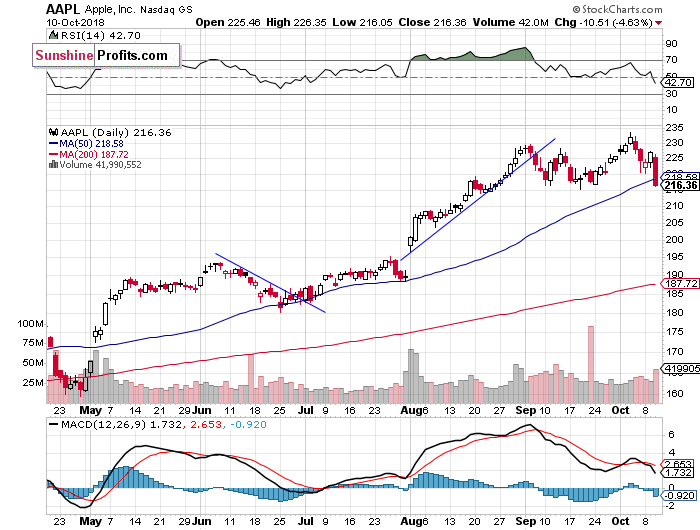
Let's take a look at Apple, Inc. stock (AAPL) daily chart. It reached the new record high at the level of $233.47 just a week ago, as it continued to act relatively strong. Then the stock retraced most of its recent rally. Tuesday's trading session was pretty bullish, as the price bounced off the support level. But then it sold off yesterday, as it got close to the support level of around $215 again. Is this a new downtrend or just a consolidation? If the stock price breaks below the short-term support level, it might continue towards $200 mark:
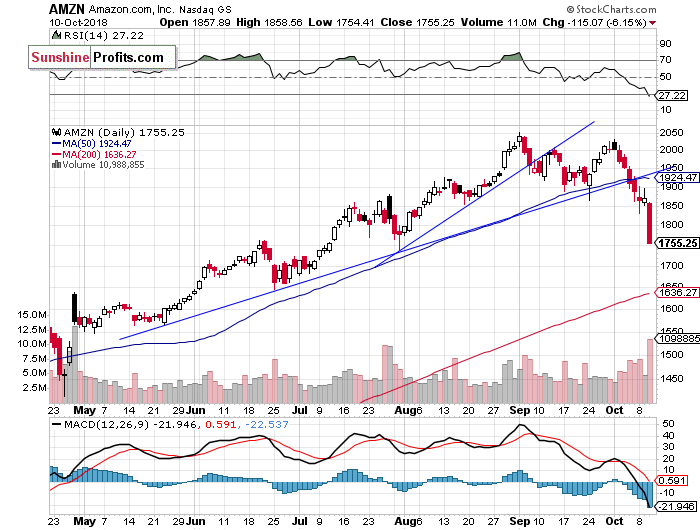
Now let's take a look at Amazon.com, Inc. stock (AMZN) daily chart. It was relatively weaker than the Apple stock recently, as it was trading within a clear short-term downtrend. The stock broke below its medium-term upward trend line on Friday. It continued below the recent local low of $1,865 on Monday. Then it sold off sharply yesterday. There have been no confirmed positive signals so far:
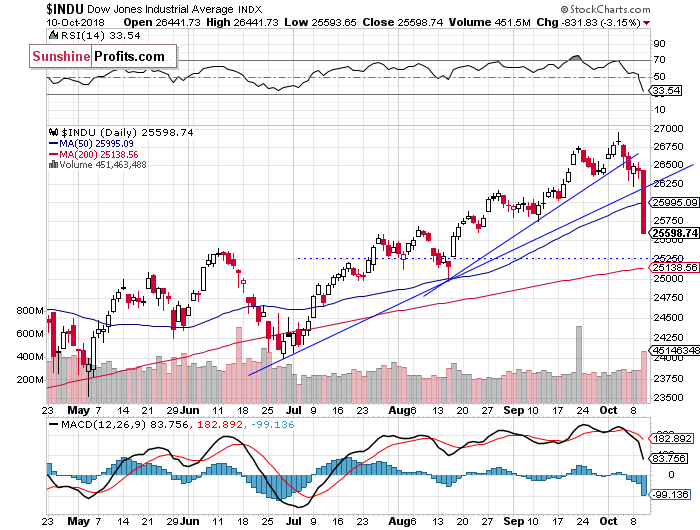
Dow Jones Breaks Lower
The Dow Jones Industrial Average reached its new all-time high at the level of 26,951.81 on Wednesday a week ago. Then the blue-chip stocks' gauge broke below its two-month-long upward trend line on Friday. It looked like a downward correction, but the market fell below its medium-term upward trend line and the support level of around 26,000 yesterday. Then it accelerated much lower. The decline may extend towards the support level of around 25,000-25,250:
The S&P 500 index sold off sharply on Wednesday, following breaking down below its recent local lows. The market sharply reversed its medium-term uptrend yesterday. But will it continue much lower from here? We may see an attempt at bouncing off the mentioned medium-term support levels. There is the "October Effect" theory. It says that stocks tend to decline or crash during the month of October. Well, we can see a very sharp decline this month. So it is some kind of a stock seasonality pattern.
Concluding, the S&P 500 index will probably open lower today. Then we may see attempts at bouncing off the support levels. But if the bulls fail, we may see more downward pressure and a move towards 2,700 mark. There have been no confirmed short-term positive signals so far. However, we can see some technical oversold conditions.
Want free follow-ups to the above article and details not available to 99%+ investors? Sign up to our free newsletter today!
Author

Paul Rejczak
Sunshine Profits
Paul Rejczak is a stock market strategist who has been known for the quality of his technical and fundamental analysis since the late nineties.


