SAP SE  is a multinational corporation which is well known as a producer of the enterprise software being used in managing business operations and customer relations. Founded in 1972 and headquartered in Walldorf, Germany, the company’s most famous product is the enterprise resource planning (ERP) software. The company is a part of both DAX30 and of SX5E indices. In recent weeks, SAP contributes also actively in the fight against COVID-19 by developing of the contact tracing software. However, will that acttivity help the stock price to recover from the recent fall?

SAP Monthly Elliott Wave Analysis 05.18.2020

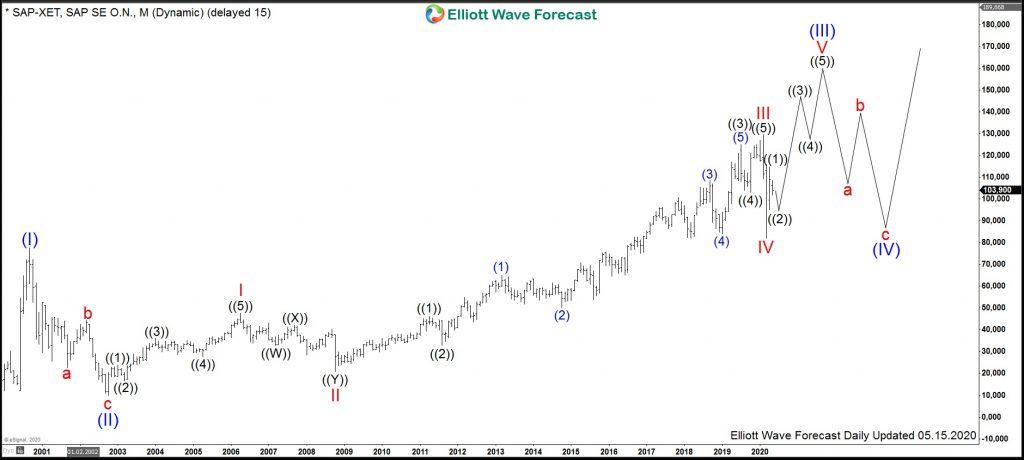
The monthly chart below shows the SAP stock $SAP traded at XETRA. From the all-time lows, the stock price has developed its first significant push higher in wave (I) of super cycle degree. This impulsive move up has printed a top in September 2000 at 77.50. From the peak, the wave (II) has provided a consolidation of the stock price in 3 waves lower as a zigzag correction towards the October 2002 lows at 9.92. So now, that level became the starting point of a larger move to the upside. The rally higher is the wave (III) of the super cycle degree. As a matter of fact, it reveals a clearly visible Elliott wave impulsive wave structure. Now, it is the preferred view that the wave (III) remains still in progress.

Within the super cycle in wave (III), the red wave I has ended in April 2006 at 47.68, the red wave II lower has found a bottom in October 2008 at 20.76. From that level on, the wave III has provided an extension higher towards the all-time highs in February 2020.

SAP Weekly Elliott Wave Analysis 05.18.2020 and Outlook

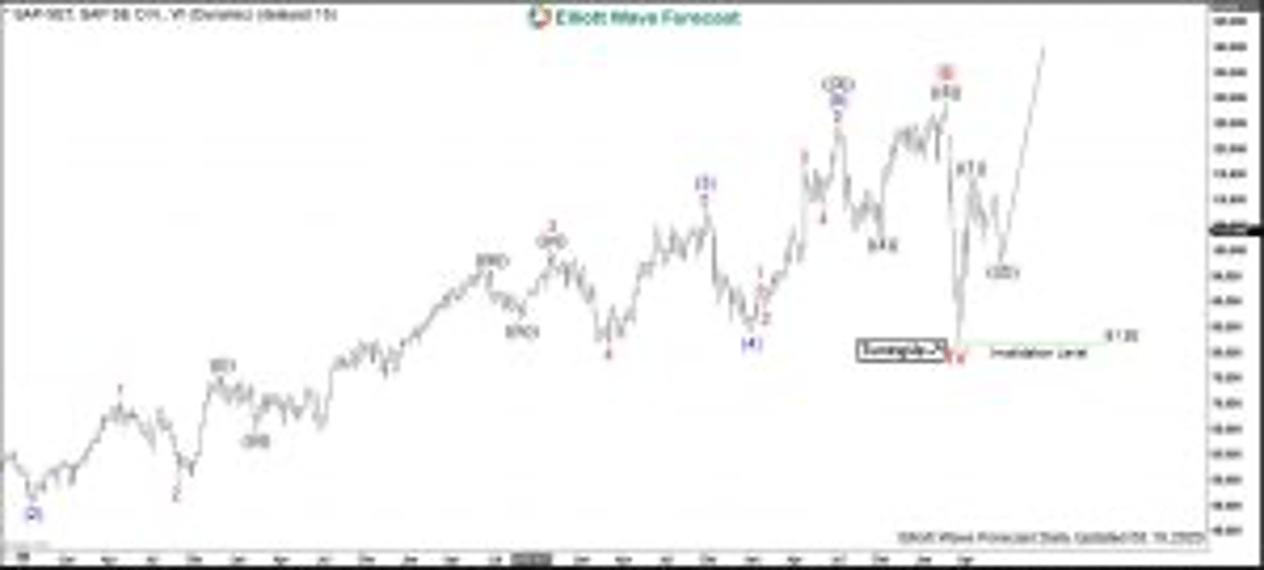
The weekly chart below shows in more detail the subdivisions of the extended wave III of (III).  Wave III has peaked in February 2020 at 129.60. From there, a sharp decline in wave IV has delivered the march low at 81.92. While above there, the price can be now turning up in wave V of (III). In short-term cycles, wave ((1)) of primary degree is currently being corrected lower in the wave ((2)). The pullback should hold above 81.92. Then, SAP stock price should see waves ((3)), ((4)) and ((5)) of V to end the cycle from 2002 lows.

The target area for the termination point of wave V will be 140.30-158.65. This projection area originates from the inverse Fibonacci relationship of 1.23-1.618 between the lengths of the red waves IV and V. Alternatively, the stock price can do another swing higher and fall lower in a double correction. It can also do a sideways action in wave IV as a triangle. The preferred view remains that the prices will remain above the march lows. Therefore, buyers can enter the market in 3, 7, 11 swings for more upside towards 140.30-158.65 area or for at least another leg higher.


FURTHER DISCLOSURES AND DISCLAIMER CONCERNING RISK, RESPONSIBILITY AND LIABILITY Trading in the Foreign Exchange market is a challenging opportunity where above average returns are available for educated and experienced investors who are willing to take above average risk. However, before deciding to participate in Foreign Exchange (FX) trading, you should carefully consider your investment objectives, level of xperience and risk appetite. Do not invest or trade capital you cannot afford to lose. EME PROCESSING AND CONSULTING, LLC, THEIR REPRESENTATIVES, AND ANYONE WORKING FOR OR WITHIN WWW.ELLIOTTWAVE- FORECAST.COM is not responsible for any loss from any form of distributed advice, signal, analysis, or content. Again, we fully DISCLOSE to the Subscriber base that the Service as a whole, the individual Parties, Representatives, or owners shall not be liable to any and all Subscribers for any losses or damages as a result of any action taken by the Subscriber from any trade idea or signal posted on the website(s) distributed through any form of social-media, email, the website, and/or any other electronic, written, verbal, or future form of communication . All analysis, trading signals, trading recommendations, all charts, communicated interpretations of the wave counts, and all content from any media form produced by www.Elliottwave-forecast.com and/or the Representatives are solely the opinions and best efforts of the respective author(s). In general Forex instruments are highly leveraged, and traders can lose some or all of their initial margin funds. All content provided by www.Elliottwave-forecast.com is expressed in good faith and is intended to help Subscribers succeed in the marketplace, but it is never guaranteed. There is no “holy grail” to trading or forecasting the market and we are wrong sometimes like everyone else. Please understand and accept the risk involved when making any trading and/or investment decision. UNDERSTAND that all the content we provide is protected through copyright of EME PROCESSING AND CONSULTING, LLC. It is illegal to disseminate in any form of communication any part or all of our proprietary information without specific authorization. UNDERSTAND that you also agree to not allow persons that are not PAID SUBSCRIBERS to view any of the content not released publicly. IF YOU ARE FOUND TO BE IN VIOLATION OF THESE RESTRICTIONS you or your firm (as the Subscriber) will be charged fully with no discount for one year subscription to our Premium Plus Plan at $1,799.88 for EACH person or firm who received any of our content illegally through the respected intermediary’s (Subscriber in violation of terms) channel(s) of communication.

Recommended Content


Recommended Content

Editors’ Picks

AUD/USD bounces to 0.6450, shrugs off mixed Australian jobs data

AUD/USD bounces to 0.6450, shrugs off mixed Australian jobs data

AUD/USD is rebounding to test 0.6450 amid renewed US Dollar weakness in the Asian session on Thursday. The pair reverses mixed Australian employment data-led minor losses, as risk sentiment recovers. 

AUD/USD News

USD/JPY bounces back toward 154.50 amid risk-recovery

USD/JPY bounces back toward 154.50 amid risk-recovery

USD/JPY bounces back toward 154.50 in Asian trading on Thursday, having tested 154.00 on the latest US Dollar pullback and Japan's FX intervention risks. A recovery in risk appetite is aiding the rebound in the pair. 

USD/JPY News

Gold rebounds on market caution, aims to reach $2,400

Gold rebounds on market caution, aims to reach $2,400

Gold price recovers its recent losses, trading around $2,370 per troy ounce during the Asian session on Thursday. The safe-haven yellow metal gains ground as traders exercise caution amidst heightened geopolitical tensions in the Middle East.

Gold News

Manta Network price braces for volatility as $44 million worth of MANTA is due to flood markets

Manta Network price braces for volatility as $44 million worth of MANTA is due to flood markets

Manta Network price was not spared from the broader market crash instigated by a weakness in the Bitcoin market. While analysts call a bottoming out in the BTC price, the Web3 modular ecosystem token could suffer further impact.

Read more

Investors hunkering down

Investors hunkering down

Amidst a relentless cautionary deluge of commentary from global financial leaders gathered at the International Monetary Fund and World Bank Spring meetings in Washington, investors appear to be taking a hiatus after witnessing significant market movements in recent weeks.

Read more

Majors

Cryptocurrencies

Signatures