Santa Clause Rally Continues
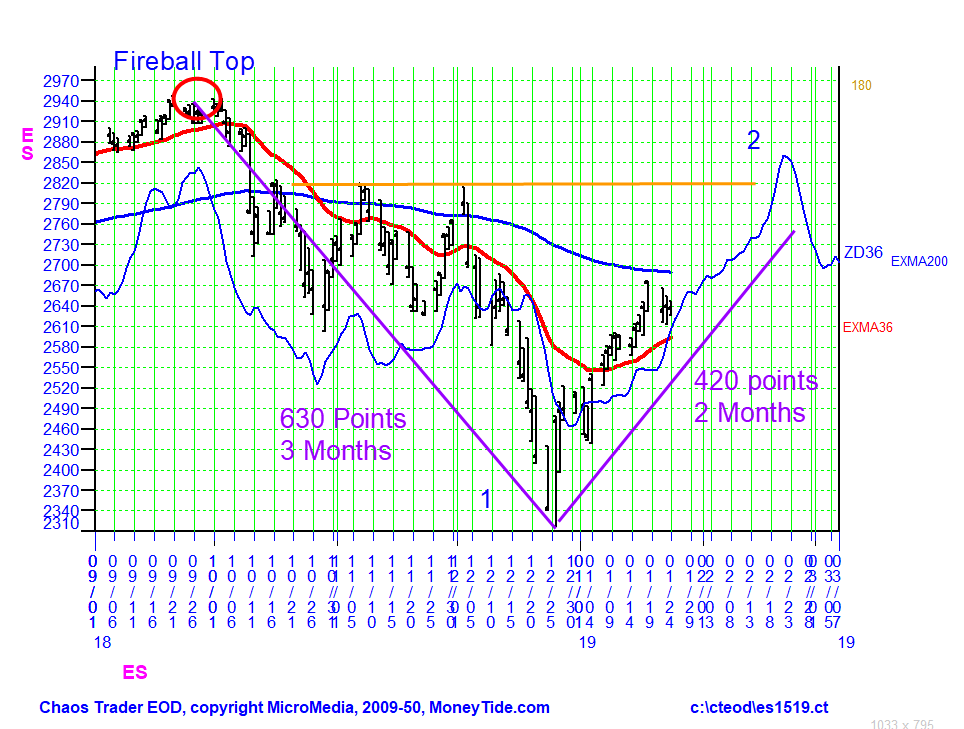
The S&P made it's all time high September 21, 2018, forming a Fireball Top. From there it declined into a low on December 26th. Since then it has rallied, leading many to believe the bull market is back. I do not think so.
The chart above shows my ZD36 energy field forecast for the S&P. This is made with my WinXGO program, which produces an XGO forecast, then filters it with a 36 day Zero Delay filter. This gives a forecast for energy changes, but not for exact price. To use this forecast on scales ZD forecast to approximate the price moves. So time is more accurate than price.
The ZD36 forecast shows the Santa Claus rally topping out near February 21st. The ZD36 as plotted suggest a price high near 2850. That is probably too high. During the decline there was major resistance near 2820. That resistance formed just above the declining 200 day EXMA. That EXMA is now just below 2700.
In simple terms, the ZD forecast is down for 3 months, up for 2 months. This 2:3 ratio is the basis of the musical scale, and part of the Fibonacci sequence. With equal speeds, the 3 month decline of about 630 points suggests a 2 month rally of 420 points, to about 2736.
We will know more by the end of February. It the market turns down as forecast, moves 1 and 2 of a 7 move down Chaos Clamshell will be in place. A Chaos Clamshell is a fractal pattern of 7 moves. You can learn more about it at Moneytide.com Under the Course link, you will find a link for a free course Trading The Chaos Clamshell.
--
This content was published on Dr. Al Larson's Chaos Clinic which you can attend each Friday for free.
Dr. Al Larson has developed a complete Chaos Model of Markets, four unique courses that let you become a Certified Chaos Trader, some very unique eMylar fractal pattern overlays, and tools that permit forecasting individual stocks and markets years in advance. You can also sign up for a free weekly email, and attend a free Chaos Clinic on Fridays. To learn more, click on the author's profile.
Be sure to sign up for the free weekly email!
Author

Dr. Al Larson, PhD
MoneyTide.com
Dr. Al Larson holds a Ph.D. in Electrical and Computer Engineering from the University of Wisconsin. He is a 1964 Distinguished Graduate of the U. S. Air Force Academy.


