Santa Claus rally in 2024?

USD: Dec '24 is Up at 106.695.
Energies: Jan '25 Crude is Down at 70.20.
Financials: The Mar '25 30 Year T-Bond is Up 6 ticks and trading at 116.14.
Indices: The Dec '24 S&P 500 emini ES contract is 36 ticks Higher and trading at 6064.50.
Gold: The Feb'25 Gold contract is trading Up at 2680.10.
Initial conclusion
This is not a correlated market. The USD is Up and Crude is Down which is normal, and the 30 Year T-Bond is trading Higher. The Financials should always correlate with the US dollar such that if the dollar is Higher, then the bonds should follow and vice-versa. The S&P is Higher and Crude is trading Lower which is correlated. Gold is trading Higher which is not correlated with the US dollar trading Up. I tend to believe that Gold has an inverse relationship with the US Dollar as when the US Dollar is down, Gold tends to rise in value and vice-versa. Think of it as a seesaw, when one is up the other should be down. I point this out to you to make you aware that when we don't have a correlated market, it means something is wrong. As traders you need to be aware of this and proceed with your eyes wide open. Asia traded Lower with the exception of the Singapore exchange. All of Europe is trading Lower.
Possible challenges to traders
-
Empire State Manufacturing is out at 8:30 AM EST. This is Major.
-
Flash Manufacturing is out at 9:45 AM EST. This is Major.
-
Flash Services PMI is out at 9:45 AM EST. This is Major.
Traders, please note that we've changed the Bond instrument from the 10 year (ZN) to the 2 year (ZT). They work exactly the same.
We've elected to switch gears a bit and show correlation between the 2-year Treasury notes (ZT) and the S&P futures contract. The YM contract is the Dow Jones Industrial Average, and the purpose is to show reverse correlation between the two instruments. Remember it's likened to a seesaw, when up goes up the other should go down and vice versa.
On Friday the ZT migrated Higher at around 8 AM EST with no economic news in sight. The Dow dived Lower at the same time. Look at the charts below and you'll see a pattern for both assets. The Dow moved Lower at 8 AM and the ZT moved Higher at around the same time. These charts represent the newest version of Bar Charts, and I've changed the timeframe to a 15-minute chart to display better. This represented a Long opportunity on the 2-year note, as a trader you could have netted about a dozen ticks per contract on this trade. Each tick is worth $7.625. Please note: the front month for ZT is now Mar '25 and the Dow is still Dec '24. I've changed the format to filled Candlesticks (not hollow) such that it may be more apparent and visible.
Charts courtesy of barcharts
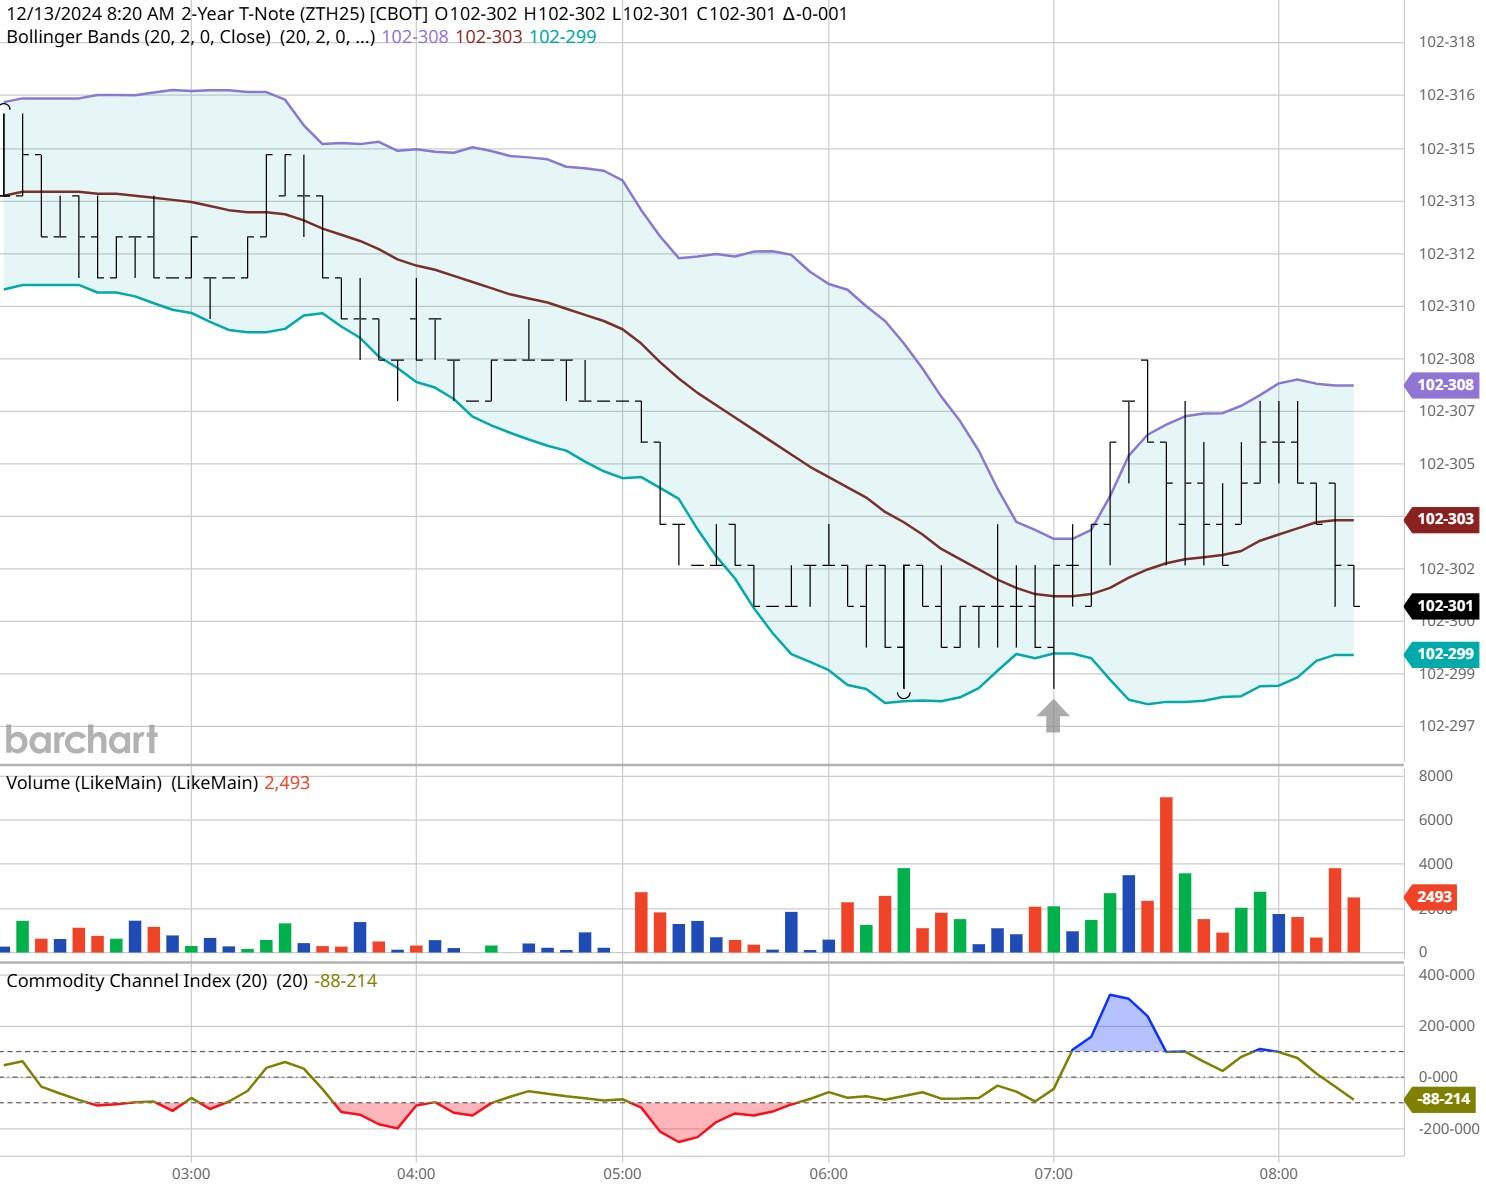
ZT -Mar 2025 - 12/13/24
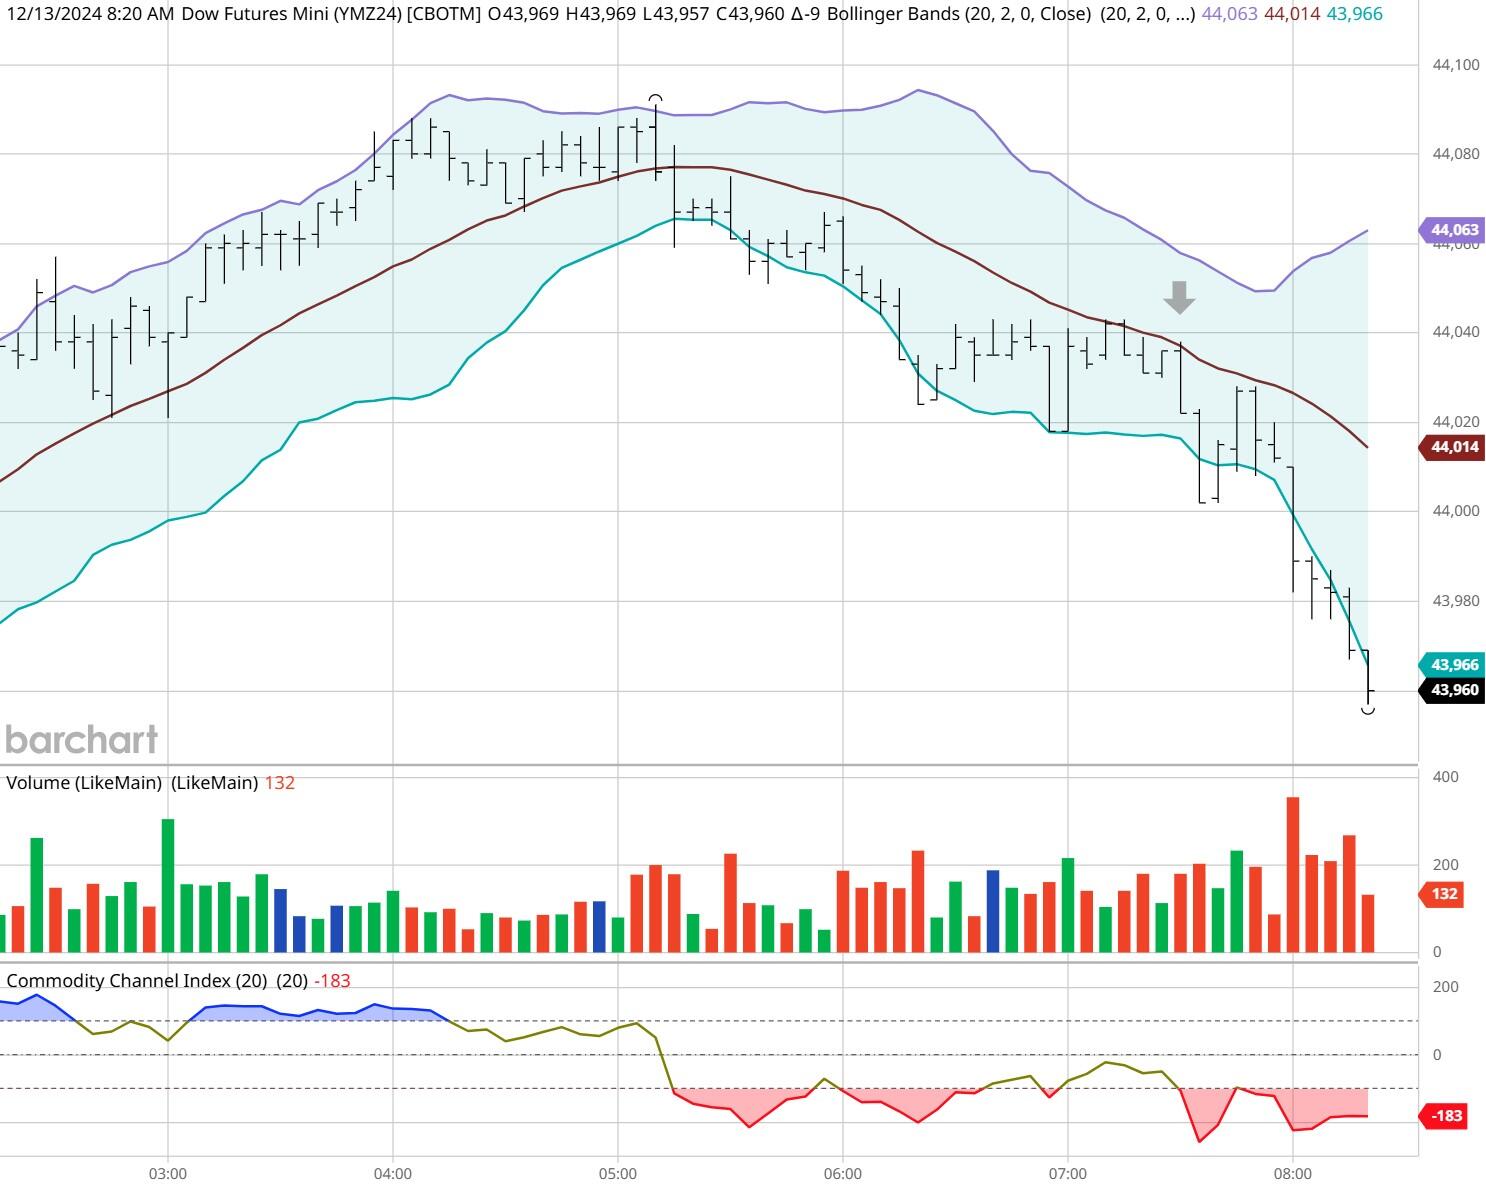
Dow - Dec 2024 - 12/13/24
Bias
On Friday we gave the markets an Upside bias however the markets had other ideas as the Dow dropped 86 points, the S&P dropped one point, but the Nasdaq gained 23. Today we aren't dealing with a correlated market and our bias is Neutral or Mixed.
Could this change? Of Course. Remember anything can happen in a volatile market.
Commentary
So, this time of year, we always ask ourselves the same question: will we see the proverbial Santa Claus rally this year? Truth is we really haven't had one for at least a couple of years. Goldman Sachs says we will due to a large influx of capital into the US stocks and they may be right. However, another point that might be overlooked is the FOMC meeting to be held this Wednesday. If the Fed does this then there is a strong indication for a market rally and if they don't probably not. If the Fed truly wants to propel consumer spending then an interest rate reduction would be ideal. Our thought is if they do, it will be minimal at best; perhaps a quarter point as I don't think the Fed is sold on a booming economy but as in all things, only time will tell.
Author

Nick Mastrandrea
Market Tea Leaves
Nick Mastrandrea over 20 years experience in trading and formerly held a NASD Series 7. He currently holds a NJ Life, Health and Variable Authority. Nick is a published writer and his work has appeared in Futures Magazine, TraderPlanet and others.


