Santa Claus Rally?
Good Morning Traders,
As of this writing 4:05 AM EST, here’s what we see:
US Dollar: Dec. USD is Down at 100.895.
Energies: January Crude is Down at 45.52.
Financials: The Dec 30 year bond is Up 23 ticks and trading at 153.17.
Indices: The December S&P 500 emini ES contract is 39 ticks Lower and trading at 2201.50.
Gold: The December gold contract is trading Up at 1194.40. Gold is 160 ticks Higher than its close.
Initial Conclusion
This is not a correlated market. The dollar is Down- and crude is Down- which is not normal but the 30 year bond is trading Up. The Financials should always correlate with the US dollar such that if the dollar is lower then bonds should follow and vice-versa. The indices are Down and Crude is trading Down which is not correlated. Gold is trading Up which is correlated with the US dollar trading Down. I tend to believe that Gold has an inverse relationship with the US Dollar as when the US Dollar is down, Gold tends to rise in value and vice-versa. Think of it as a seesaw, when one is up the other should be down. I point this out to you to make you aware that when we don’t have a correlated market, it means something is wrong. As traders you need to be aware of this and proceed with your eyes wide open.
Asia traded mainly Higher with the exception of the Japanese Nikkei exchange. As of this writing all of Europe is trading Lower at this hour.
Possible Challenges To Traders Today
– No major economic news to speak of.
– Lack of major economic news.
Treasuries
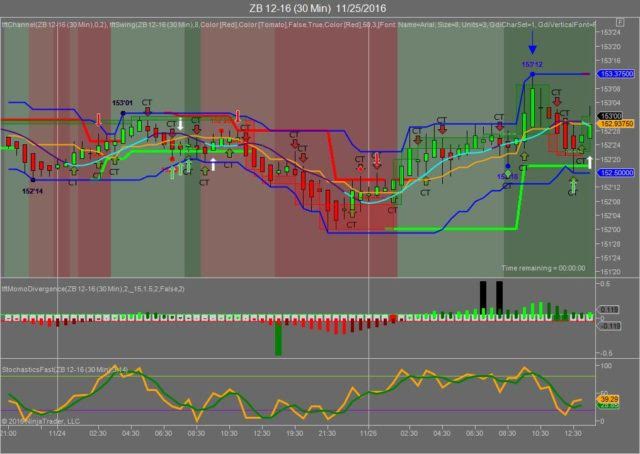
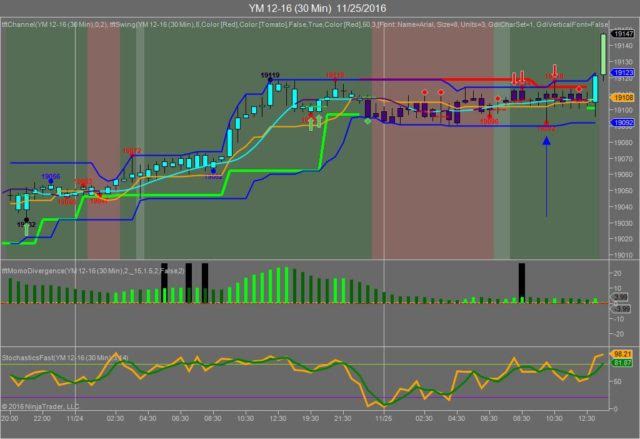
We’ve elected to switch gears a bit and show correlation between the 30 year bond (ZB) and The YM futures contract. The YM contract is the DJIA and the purpose is to show reverse correlation between the two instruments. Remember it’s liken to a seesaw, when up goes up the other should go down and vice versa.
On Friday the ZB made it’s move at 10 AM EST with no economic news in sight. The ZB hit a high at around that time and the YM hit a low. If you look at the charts below ZB gave a signal at around 10 AM EST and the YM was moving higher at the same time. Look at the charts below and you’ll see a pattern for both assets. ZB hit a high at around 10 AM EST and the YM hit a low. These charts represent the latest version of Trend Following Trades and I’ve changed the timeframe to a 30 minute chart to display better. This represented a shorting opportunity on the 30 year bond, as a trader you could have netted about 20 plus ticks per contract on this trade. Each tick is worth $31.25. We added a Donchian Channel to the charts to show the signals more clearly.
Charts Courtesy of Trend Following Trades built on a NinjaTrader platform
Bias
Last Wednesday just prior to the Thanksgiving Holiday our bias was neutral as the USD, the Bonds and Gold were all trading higher and this ordinarily would have signaled a downside bias except the futures were trading higher as well. On Wednesday the Dow advanced 59 points and this past Friday it advanced 69 points. Today we aren’t dealing with a correlated market and our bias is neutral.
Could this change? Of Course. Remember anything can happen in a volatile market.
Commentary
We just celebrated the Thanksgiving Holiday in the United States and just prior to the holiday the Dow advanced 59 points and even during the the abbreviated holiday session (the markets closed at 1 PM EST on Friday) the Dow again advanced 69 points. The question is can the markets maintain and keep this tempo going in December and until Christmas? Usually at around this time of year we discuss the prospect and possibility of a Santa Claus rally and some years we get it and other years we don’t. We are particularly poised this year for such a rally as since Election Day the markets have been on a rampage to make up and advance to higher ground. This year (given that it was an Election Year) the markets have had difficulty getting to and maintaining a higher high. At this point the markets want to advance as we now know who the next President will be. The one fly in the ointment? We have an FOMC Meeting in December and this could change everything. Do we think the Fed will hike? No, we don’t if only because they don’t want to do anything to upset consumer spending for the holidays. But as we say each day in this newsletter “this could change”
Author

Nick Mastrandrea
Market Tea Leaves


