Safe haven asset outflows continue as risk appetite improves

Market Overview
As risk appetite shows signs of improvement, the flow out of safe haven assets seems to be continuing on Monday morning. With no increased provocation to speak of on the Korean Peninsula, investors are moving out of gold, the yen and US Treasuries in search for higher yielding, more risky assets. This move means that the technical positions on gold and the yen are on the brink of a significant change in outlook. So often in recent weeks any unwinding moves have simply been seen as a chance to buy into gold and the yen. However, this configuration is close to breaking down now. As we approach the September FOMC meeting, Treasury yields have already broken their negative trends with the probability of a December rate hike once again in the balance. This change of sentiment is seemingly helping to support equity markets once more with a positive reaction early today. This is shaping up to be a pivotal week on financial markets, with the Fed monetary policy on Wednesday and German election next weekend. The outlook is initially positive.

Wall Street closed at yet further all-time highs on Friday, with the S&P 500 up +0.2% closing above 2500 for the first time. Asian markets have also been positive today although the Nikkei was closed for a Japanese public holiday. European markets are also higher in early moves. In forex the risk positive theme continues to show, with yen underperformance and decent gains on the commodity currencies such as the Aussie and Kiwi. It is also interesting to see sterling hanging on to the sharp gains of last week. In commodities, gold and silver are still dipping lower, whilst oil is again finding support.
It is a fairly quiet start to the week, with revised Eurozone inflation and some US housing data on the card. At 1000BST the final Eurozone inflation for August is announced, which is expected to show no change from the flash data two weeks ago, with headline CPI of +1.5% YoY and the core CPI to confirm a slight drop to +1.2%. Into the afternoon, the US National Association of Home Builders releases its Housing Market Index at 1500BST and is expected to drop back to 67 (from a three month high of 68 last month).
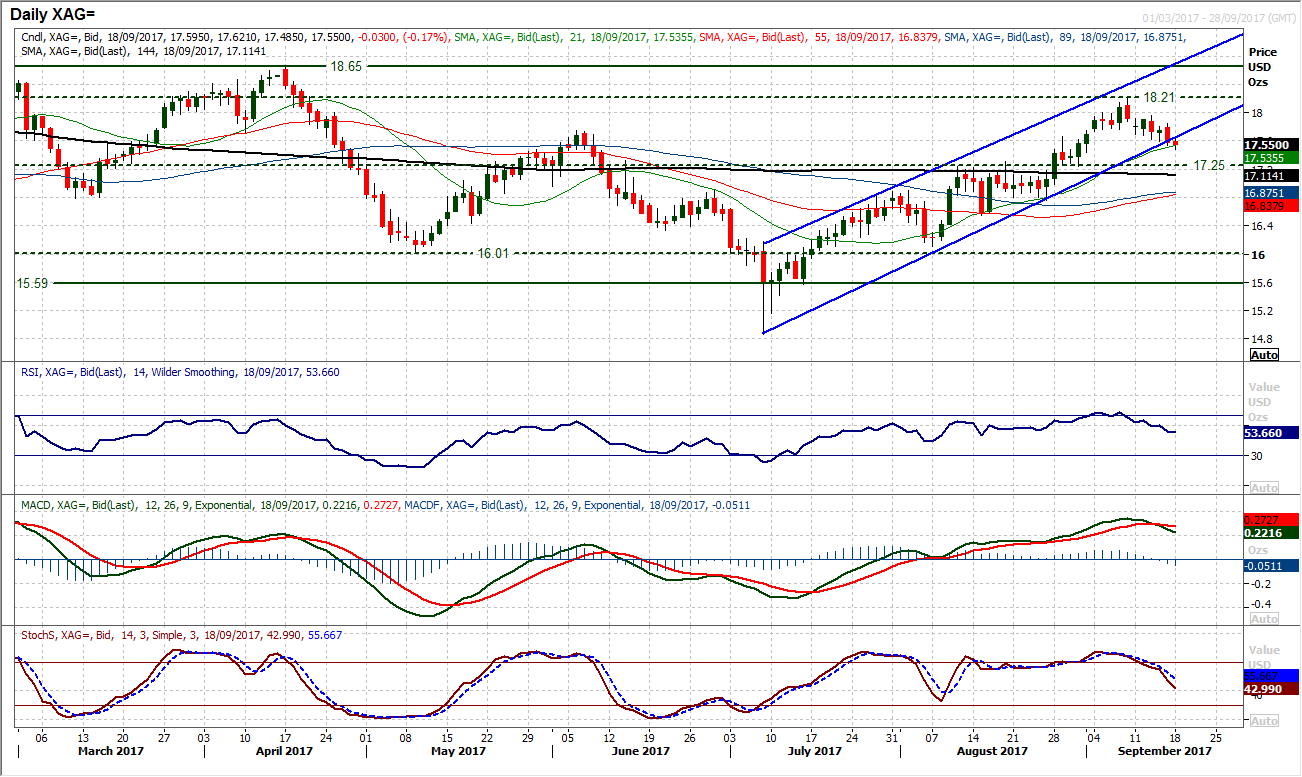
Chart of the Day – Silver
Precious metals have come under pressure in the past week as the dollar has rallied and the safe haven flow from geopolitical risk has run somewhat dry. A run of corrective candles has brought silver back to test the support of its 10 week uptrend channel once more. The $17.75 support of the breakout of the June high has already been breached and the rising 21 day moving average (which has supported recent corrective moves) comes in at $17.52 today and a closing breach would continue the correction of the past week. However, momentum indicators are looking increasingly corrective now, with the Stochastics accelerating lower following a confirmed sell signal, a sell signal also on the MACD lines. If the RSI moves below 50 this would add to the corrective momentum. The next real support comes in at $17.25 which is a breakout support from August. The early move lower today is breaking the trend channel and the bear pressure is mounting. Intraday rallies of recent days continue to be sold into, leaving lower highs building up. This means that the $17.85 high from Friday will be watched, with a close above needed to really help to defer the correction.
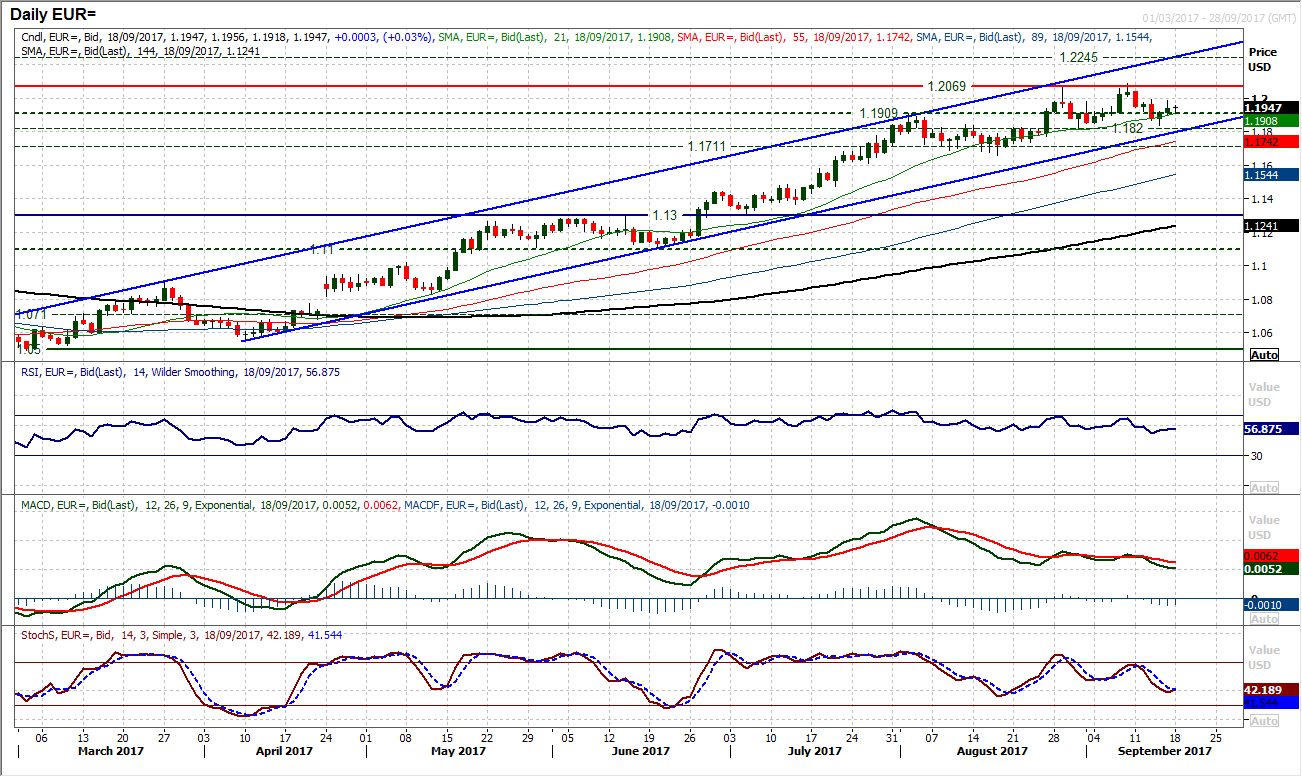
EUR/USD
The bulls have taken back a degree of control again but there is a slightly indecisive look still to the move. Corrections within the five month uptrend remain a chance to buy, however Friday’s positive session closed below the mid-point of the session and there is an uncertain look to the open today. Momentum indicators remains positively configured to suggest the correction last week is still a buying opportunity, however the market has had a couple of looks at $1.2000 again and shied away. The support remains strong at $1.1820 and whilst there is still a mild positive bias to the technicals on the hourly chart a move above $1.2000 is needed to release the shackles again. This would then help to re-open the high at $1.2092. Initial support is with Friday’s low at $1.1900.
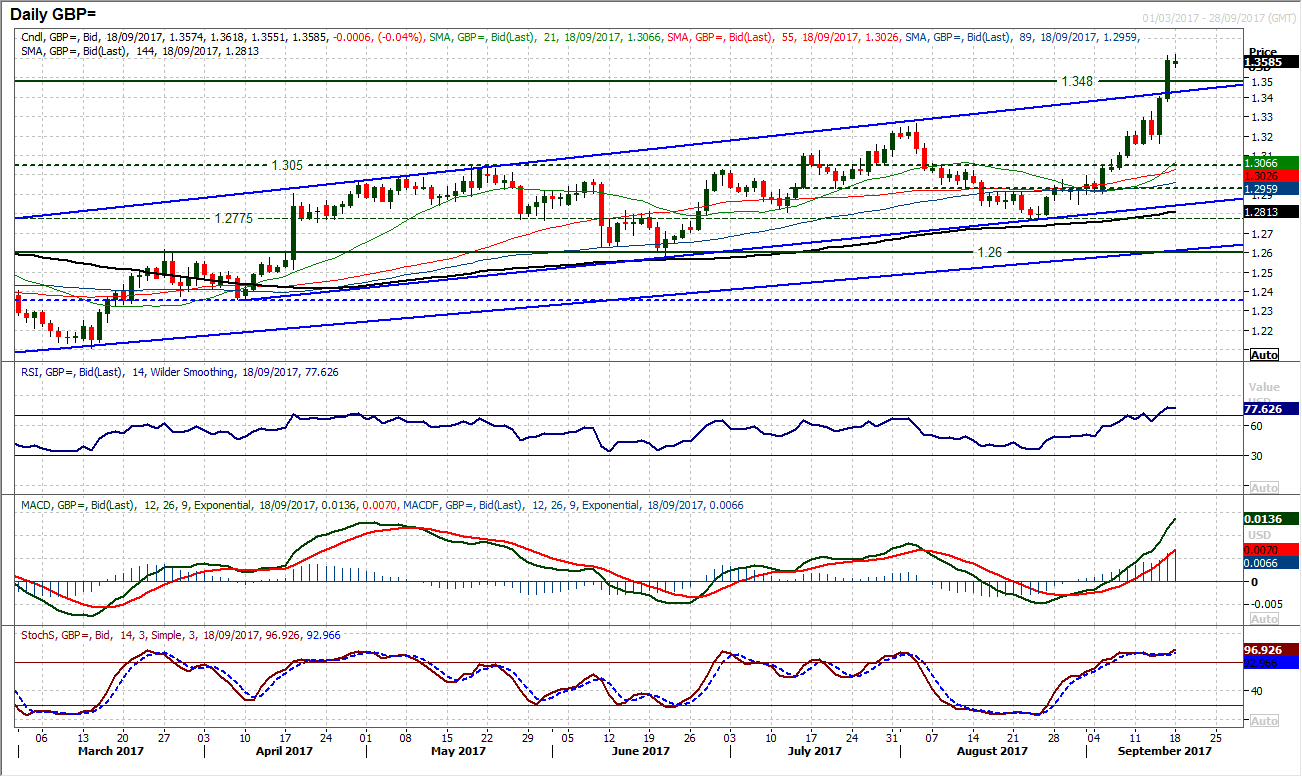
GBP/USD
An incredible push higher in the last two sessions has pulled Cable to its highest level since the day of Brexit when sterling crashed 18 big figures from $1.5000. The question now is whether there will be any near term correction after having gained 370 pips in two sessions into the close on Friday. The initial move has been one of consolidation during the Asian session, however the bulls will now look to form some support. The initial level will be a new basis of support above the key $1.3445/$1.3480 breakouts. If this can be formed then this will be the market accepting the new level for Cable. Daily momentum indicators are strong but stretched, whilst on the hourly chart there is a degree of unwinding drift. Resistance is all but limited to Friday’s high of $1.3615, as after that there is a vacuum of supply all the way until $1.3835 and $1.4000.
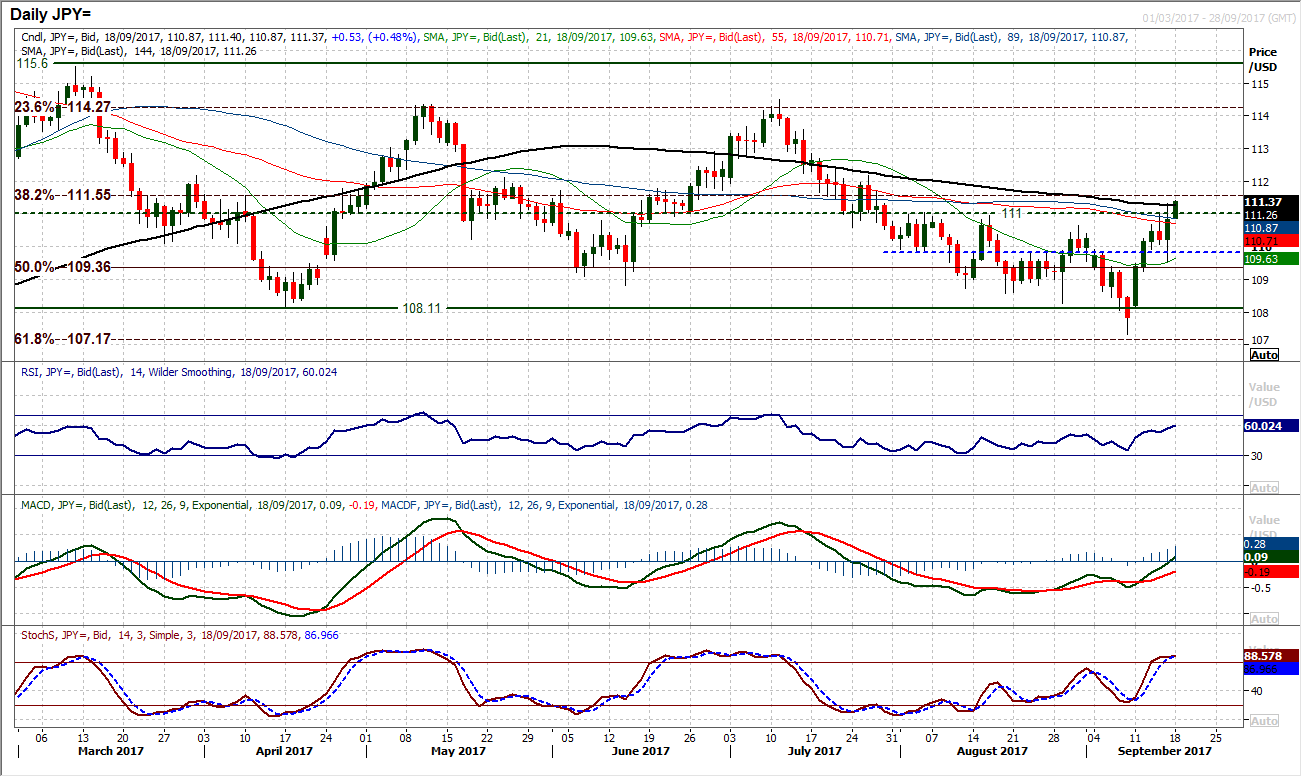
USD/JPY
Friday’s move showed a market that remained in recovery mode, however, there is an uncertain feel as to how much control the bulls can retain. Despite this, the move above 111.00 which was a key resistance throughout August is a significant move. The intraday breach on Friday could not find a closing breach and with the bulls again looking to push higher today, this will once more be the factor to watch. A closing break higher would confirm a key change in the outlook which would then drive a far more positive configuration within what is range play throughout 2017. It would then re-open the resistance of the key highs between 114 and 115. Friday’s low at 109.55 would then be seen as a higher low as the momentum of the recovery continues to improve. Another higher low above 110.65/111.00 support would then be seen as a key chance to buy. This is becoming a move that is increasingly key for the near to medium term outlook. The hourly chart shows 110.60 is initially supportive.
Gold
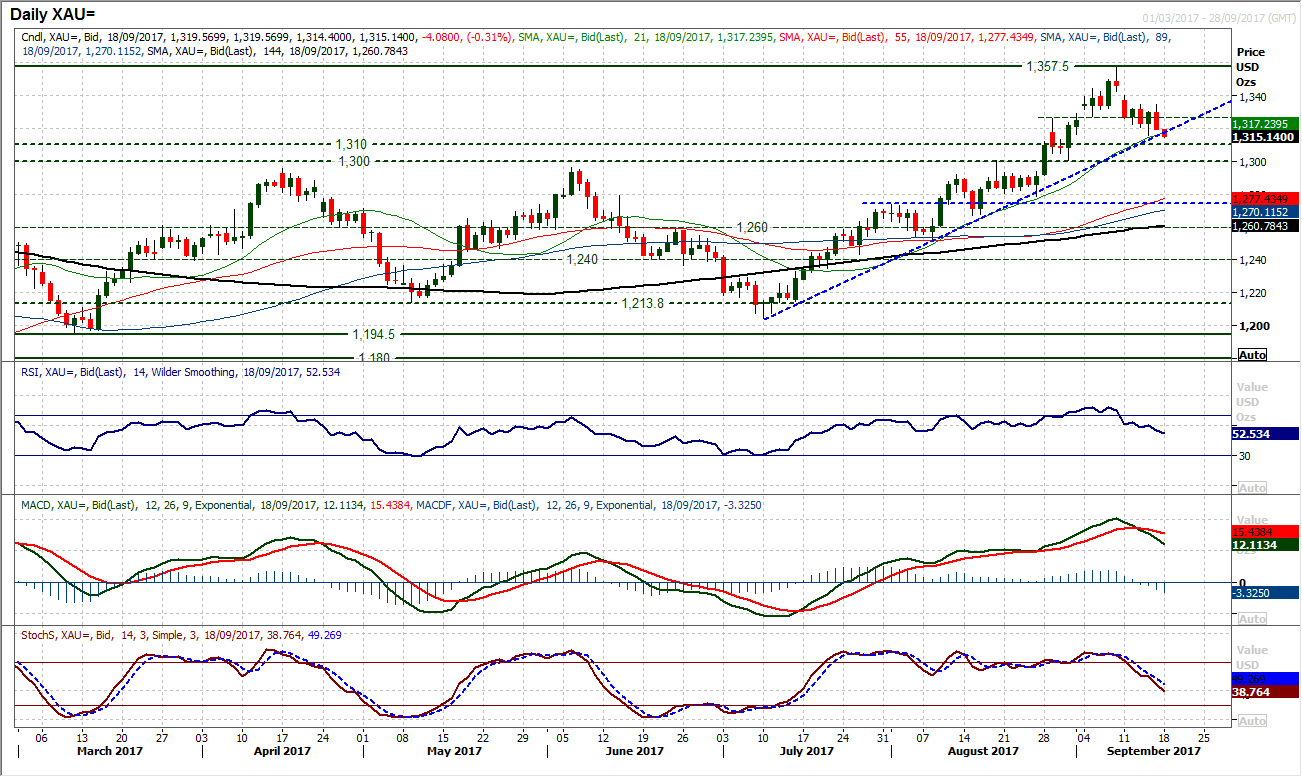
The bull run of the past ten weeks is on the brink of breaking down. The correction of the past week has taken gold back from a high at $1357.50 to test the uptrend support, today at $1317. The 21 day moving average (also at $1317) has also been a key basis of support since August and is also subsequently under threat. The main test would though be the $1300/$1310 long term key pivot which is supportive, if this were to be broken then there would be a real concern that the move would begin to accelerate. The concern is that the momentum indicators have turned increasingly corrective, with the MACD cross sell signal and Stochastics falling sharply. This would be confirmed if the RSI breached 50. Gold is close to a downside break and this morning has been testing the confluence of support. Resistance is at $1327 with $1334.70 being key now.
WTI Oil
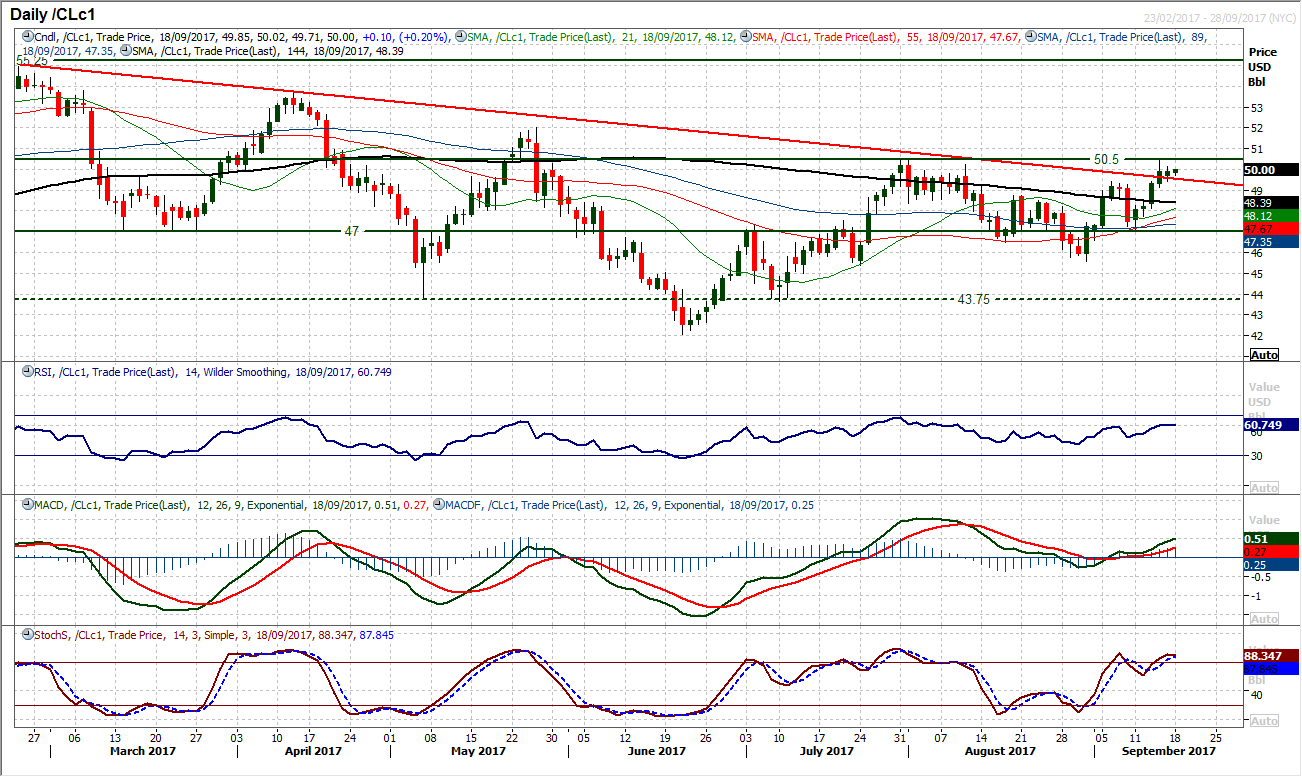
The market ended last week in consolidation mode having failed to hold on to the breakout above the August high at $50.43 and corrected back from $50.50. However, it is interesting to see that Brent Crude is strongly configured and has broken out above the May high now, the equivalent of which on the WTI chart comes in at $52.00. This should give the bulls further hope into this week and the market remains positively configured with bullish candles continuing to be posted across the sessions. The momentum is strong with the RSI pushing above 60 and the MACD lines accelerating above neutral. The breakout above $49.42 will continue to be seen as a basis of support with corrections being seen as a chance to buy. Another positive early move today suggests there is still an appetite for buying. A closing breakout above $50.50 would open $52.00 but as long as the bulls can sustain a position above the pivot at $47.00 they will consider themselves in control.
Dow Jones Industrial Average
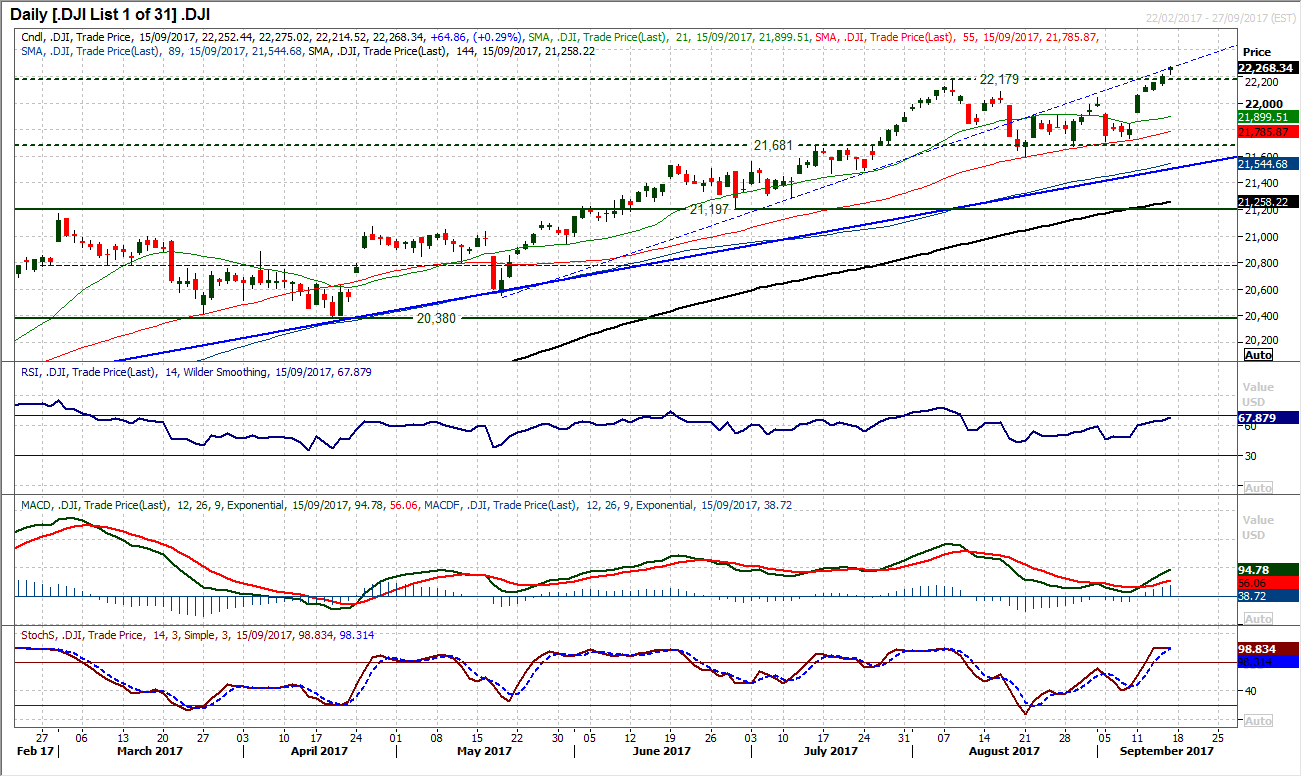
The Dow continues to push into all-time high ground despite global markets finding a degree of corrective pressure on Friday. This helps to maintain the bullish intent of Wall Street, with the strength of the momentum indicators on the Dow helping to drive the market higher. The momentum indicators remain strongly configured, with the RSI rising but not yet overstretched and the MACD lines finding traction after having only recent posted a bull cross. Subsequently corrections remain a chance to buy, with the support band of the old breakouts leaving a near term “buy zone” 22,0398/22,179. The hourly chart shows little let-up in the momentum indicators but any correction is an opportunity now.
Author

Richard Perry
Independent Analyst


