Risk recovery again pegged back by vaccine disappointment but the Fed remains supportive [Video]
![Risk recovery again pegged back by vaccine disappointment but the Fed remains supportive [Video]](https://editorial.fxstreet.com/images/Macroeconomics/CentralBanks/FED/federal-reserve-building-gm490074826-75019399_XtraLarge.jpg)
Market Overview
As we have seen on several occasions in recent weeks, the course of the risk recovery never seems able to run smoothly. What was seen as an all out risk rally on Monday has hit the buffers again. The question is how much weight markets now assign to the disappointment over Moderna’s COVID-19 vaccination trial not getting the desired data that initial claims had given. US markets pares some of the gains of the risk rally yesterday but appear to have steadied now. The supportive comments of Fed chair Powell have certainly been a key factor in recent market moves and the old adage of “never fight the Fed” once more springs to mind. US equity futures are finding support today, but given how US Treasury yields are a shade lower today, the traction of the rally has again been lost. The prospect of a trending move for risk and to break the shackles of recent ranges still remains some way off. In data out early this morning, UK inflation came in slightly lower than expected on both headline (+0.8%) and core (+1.4%). This is seeping into mild sterling underperformance this morning.
Wall Street fell into the close last night, with the S&P 500 -1.0% at 2923. However, with US futures ticking slightly higher today (E-mini S&Ps +0.4) there is at least a basis of support forming today. Asian markets have been mixed (Nikkei +0.8% and Shanghai Composite -0.6%) whilst European markets are playing catch up on the US negative close, with FTSE futures -0.7% and DAX futures -0.6%. In forex, there is a mild positive bias forming. GBP is the main underperformer along with JPY. Commodity currencies are broadly supported, whilst EUR continues to run on the legacy of the developments with regards to the EU Recovery Fund. In commodities, there has been renewed support for gold and silver, whilst oil is mixed this morning.
It is fairly Eurozone centric for the economic calendar today. First up at 0900BST there is the Eurozone Current Account for March. Then an hour latest the final Eurozone April inflation is at 1000BST. Final headline HICP is expected to be unrevised at +0.4% (+0.4% flash April, +0.7% final March). Final Core HICP is expected to also remain unrevised at +0.9% (+0.9% flash April, +1.0% final March). Then into the afternoon is Eurozone Consumer Confidence at 1500BST which is expected to slide further in May to -24.0 (from -22.7 in April). In the oil market the Weekly EIA Crude Oil Inventories at 1530BST are expected to show a mild build of +1.0m barrels (after the surprise drawdown of -0.7m barrels last week).
Sterling traders may like to keep an eye out for Bank of England Governor Andrew Bailey who is testifying before the Treasury Select Committee today at 1430BST.
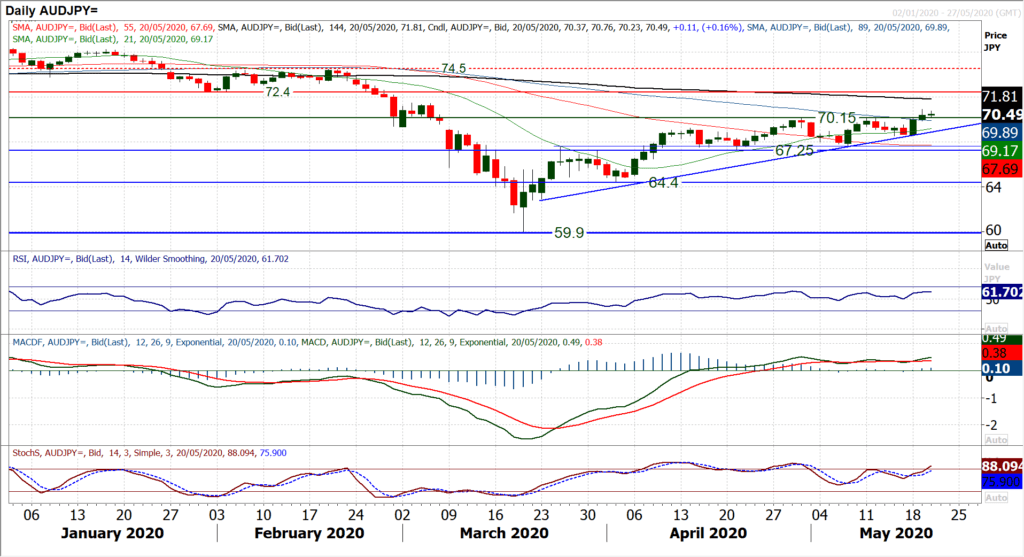
Chart of the Day – AUD/JPY
For weeks we have been fearful of the shallowing of the risk recovery, however during this time the Aussie has still been a standout performer. With a more positive risk appetite taking hold this week, the Aussie has outperformed whilst the safe haven yen has struggled. On the AUD/JPY cross, this has now formed two strong candlesticks and a decisive breakout above key resistance at 70.15. This move has taken AUD/JPY to a ten week high and opens for continued recovery towards the next resistance at 72.40. A slight pullback into the close last night has just taken the edge off some of the buying pressure, but once more the market is moving higher this morning. Momentum indicators have been consolidating recently, and they are lagging the price slightly, which lends a degree of caution. However, if RSI were to move into the mid-60s and MACD lines continue to accelerate to four month highs, it would add conviction to the upside break. The inference of yesterday’s move is an upside break from a range 67.60/70.15 which implies 250 pips of further upside towards 72.60. Initial resistance is 71.50 but a test of the next real overhead supply at 72.40 is well within scope of the move now. The range breakout at 70.15 is initial support for an intraday pullback, whilst the hourly chart shows a near term buy zone between 69.50/70.15. A failure under 68.50 would now abort the breakout potential.
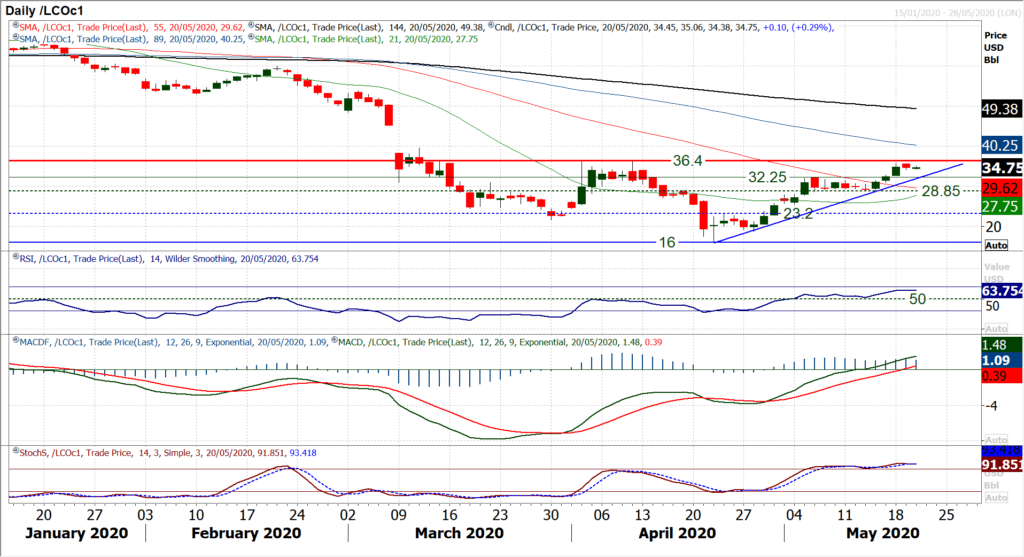
Brent Crude Oil
The June contract rollover for WTI went through without a hitch and the outlook for an oil recovery is still on track. Yesterday’s pullback into the close on Brent Crude was a mild hiccup but momentum of the rally remains positive and should encourage the bulls once more. The market is still positioning for a test of the key April resistance at $36.40, a break above which would be the next crucial step forward in the recovery (WTI has already decisively broken through its equivalent resistance). The technical development is also strong, with the RSI holding steady now in the mid-60s at its highest since early January, whilst MACD lines are rising above neutral also for the first time since January. AN uptrend flanking the recovery comes in at around $32.00 today, whilst the breakout support is $32.25. It suggests that there could still be some near term slippage which would still be an opportunity for the bulls. This is not our base scenario though, with our focus on the resistance at $36.40. If this can be overcome, the bulls will see this as a significant opportunity, as aside from an intraday high of $39.70, there is a massive March gap still to fill down from $45.20.
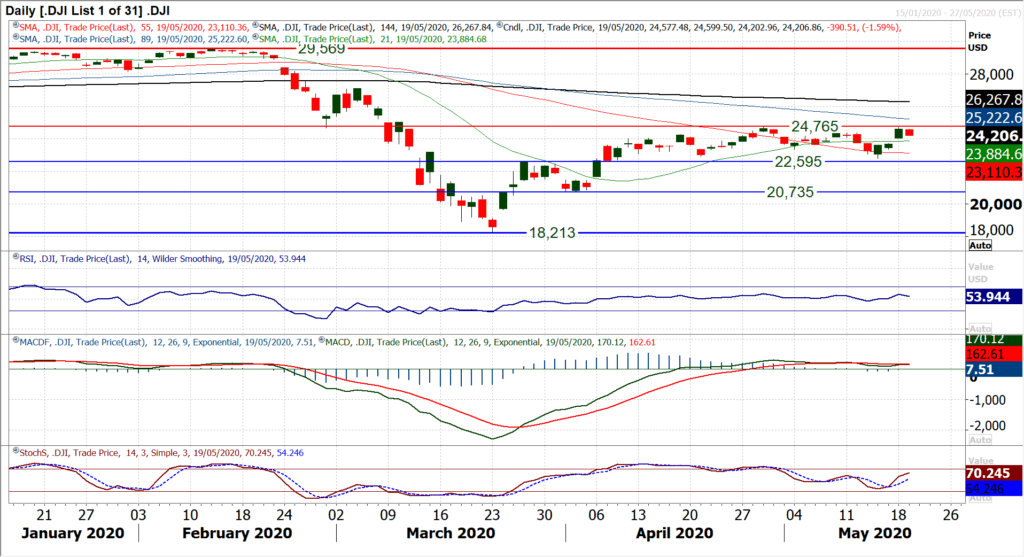
Dow Jones Industrial Average
No matter how hard they try, equity markets just cannot break the shackles of the trading range. Once more the Dow has rallied hard in recent sessions, but only to flounder at the resistance of the April high at 24,765. The re-emergence of selling pressure has posted a negative candle and cut the market 1.6% lower into the close last night. The move simply reaffirms the trading range that has formed pretty much since the early April breakout. With support at 22,790 and resistance at 24,765 the range is now over five weeks old. Moves on momentum indicators re-affirm the range, where RSI continues to oscillate between 46/60 and MACD lines are flat. Hourly indicators suggest continuing to play the range, with near term corrective (bear crosses) on Stochastics and MACD. We talked yesterday about the gap at 23,730 which was left by Monday’s session. A move below initial support at 24,060 would open a filling of the gap. Futures are ticking higher early today which hints at a positive open, but given the disappointment of yesterday’s session, the bulls are on the back foot again within this range. Resistance at 24,765 remains key.
Author

Richard Perry
Independent Analyst


