Risk-off takes a pause for breath as traders look to Congress

Market Overview
After a recent risk-off phase set in during the earlier part of the week, markets are a touch more settled today in what seems to be a brief pause for breath. This comes as traders look towards how successfully President Trump and the Republicans can get the healthcare bill through Congress. The replacement to Obamacare is being seen by traders as something of a barometer for how easily Trump may be able to get his policies on taxation, spending and deregulation through Congress, and therefore has been having a key impact on trading sentiment recently. Treasury yields have fallen sharply in recent sessions, with key safe haven plays such as the yen and gold strengthening. With equities also under selling pressure, the market has turned into a corrective phase; whilst a terrorist attack around the UK Houses of Parliament has certainly not helped the bulls either. However, these plays are seeing a pause for breath today as the market looks towards Congress. If the bill fails to make it through Congress, expect the recent risk off phase to continue. There is also a key speech from Fed Chair Yellen which is also anticipated today.

Wall Street closed mixed last night with the S&P 500 +0.2% at 2348, whilst Asian markets were also mixed (Nikkei +0.2%). European markets seem to be steadying the recent sell-off today. Forex markets are showing a consolidation too with little or no direction of note, although the Aussie is the underperformer of the day. Gold and silver are mixed around the flat line, whilst oil has managed to carry on yesterday’s late rally with further mild gains this morning.
The ongoing impact of Brexit and the views of Fed speakers will be in focus for traders today. After Tuesday’s much higher than forecast UK inflation readings, the concern will now be how this is translating to the consumer which is such an important component of the economy. At 0930 the UK Retail Sales are announced and on an adjusted ex-fuel basis are expected to show +0.4% for the month and +3.1% for the year (which is up from the previous big drop to +2.6%). However with the January data so disappointing and inflation clearly starting to bite, there will be fears of a negative surprise today. The big focus for the US session comes with the speech of Fed chair Janet Yellen at 1245GMT at a Federal Reserve conference in Washington. Fed speakers have been increasingly able to move markets in recent weeks and Yellen could yet do the same even though it is a little over a week since the Fed decision and the dearth of tier one data since is unlikely to have materially changed her view. FOMC’s Neel Kashkari (voted against the rate hike in the previous meeting) and Robert Kaplan (centrist) are also both scheduled to speak at 1630GMT and 2300GMT respectively. In other data, US weekly jobless claims are at 1230GMT and are expected to stick broadly at 240,000, whilst New Home Sales are at 1400GMT and are expected to improve slightly by +2.0% to 566,000 (from 555,000 last month).
Chart of the Day – USD/CHF
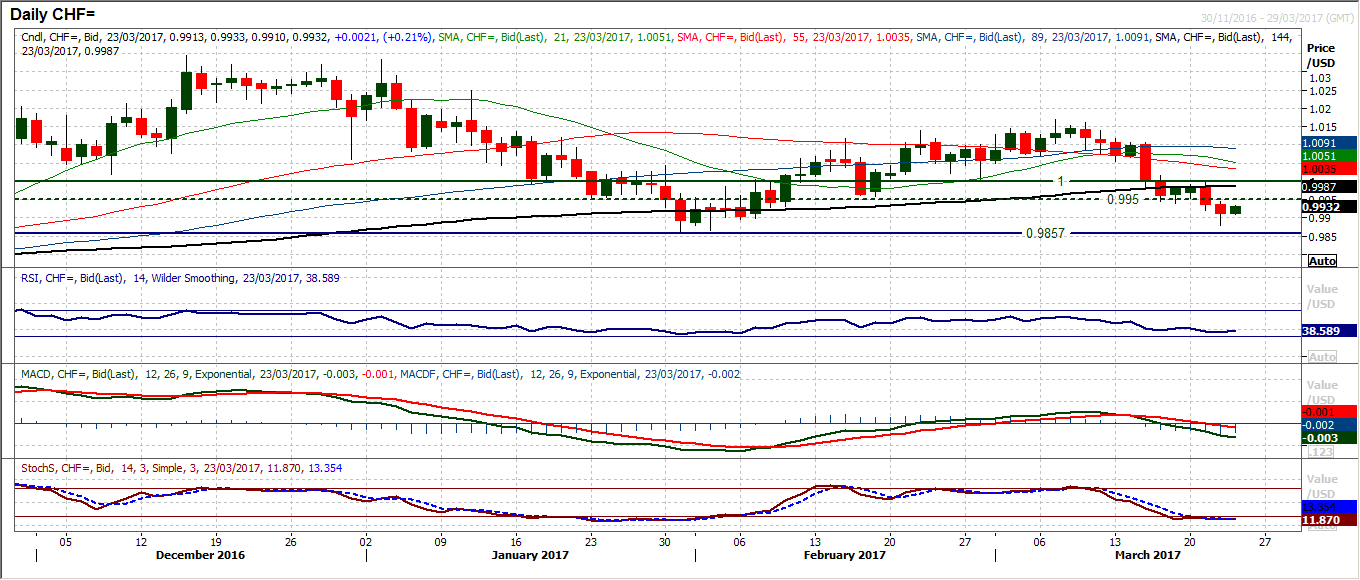
The dollar is now under pressure across the major pairs. The strength of the safe haven yen has already driven a breakout and now there is key support on Dollar/Swiss that is squarely in view. For several months the market has consistently turned around at two key levels, with 0.9950 and parity (1.0000). In the past week the market has consolidated between 0.9950 and 1.0000 and now in the last two completed sessions, 1.0000 has become key resistance before a decisive break below 0.9950 on two strong bear candles. The key January low at 0.9857 is now under threat and the bearishly configured momentum indicators suggests that intraday rallies remain a chance to sell. The RSI implies this is a key test now, with the RSI falling back in the low 30s. Over the past 11 months, the sell-offs have consistently formed support around 30/33 on the RSI, so a decisive break below 30 would be a significant change of outlook for a market that has either ranged sideways, or moved with dollar strength. However the MACD lines and Stochastics are both bearishly configured but also with downside potential. The hourly chart reflects the bearish momentum and that rallies towards 50/60 on the hourly RSI, like the one seen overnight, would be a chance to sell. Initial resistance is 0.9920 with 0.9950 key giving this a 30 pip band of near term “sell-zone” today. Initial support is 0.9880 and then the key low at 0.9857 below which opens the key November low of 0.9675 and the Trump spike low of 0.9540.
EUR/USD
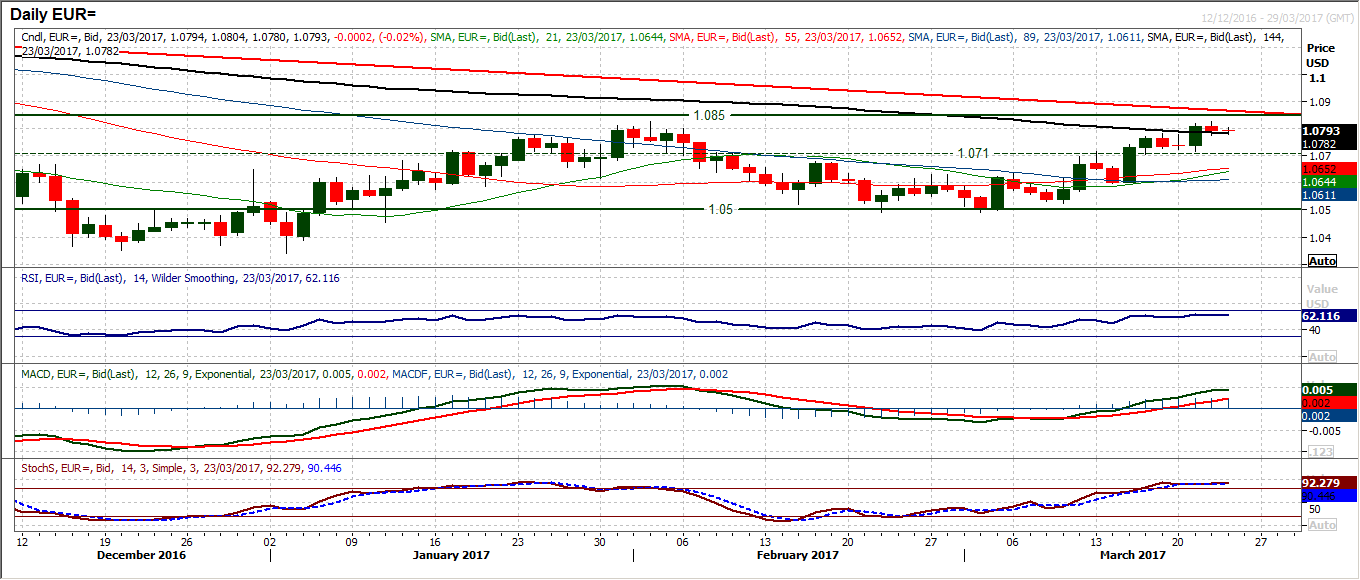
The euro consolidated some of its recent gains yesterday, however this is a move that is more of a pause for breath rather than any signal that suggests that the bulls have run out of steam. Throughout the last three weeks, rallies have been followed by minor bouts of consolidation, with the four strong bull candles in March all then finding subsequent days of consolidation. Whilst the euro holds above the breakout at $1.0710 there is little reason not to expect another leg higher to really put pressure on the $1.0800/$1.0850 medium term resistance band. Momentum remains strongly configured with the RSI above 60 and MACD lines rising. The hourly chat shows the support of the near term old highs between $1.0770/$1.0785 is a basis of lows today to build from and with the hourly momentum unwound, this is somewhere for the bulls to build from. I continue to see the resistance band $1.0800/$1.0850 as a key medium term outlook changing area.
GBP/USD
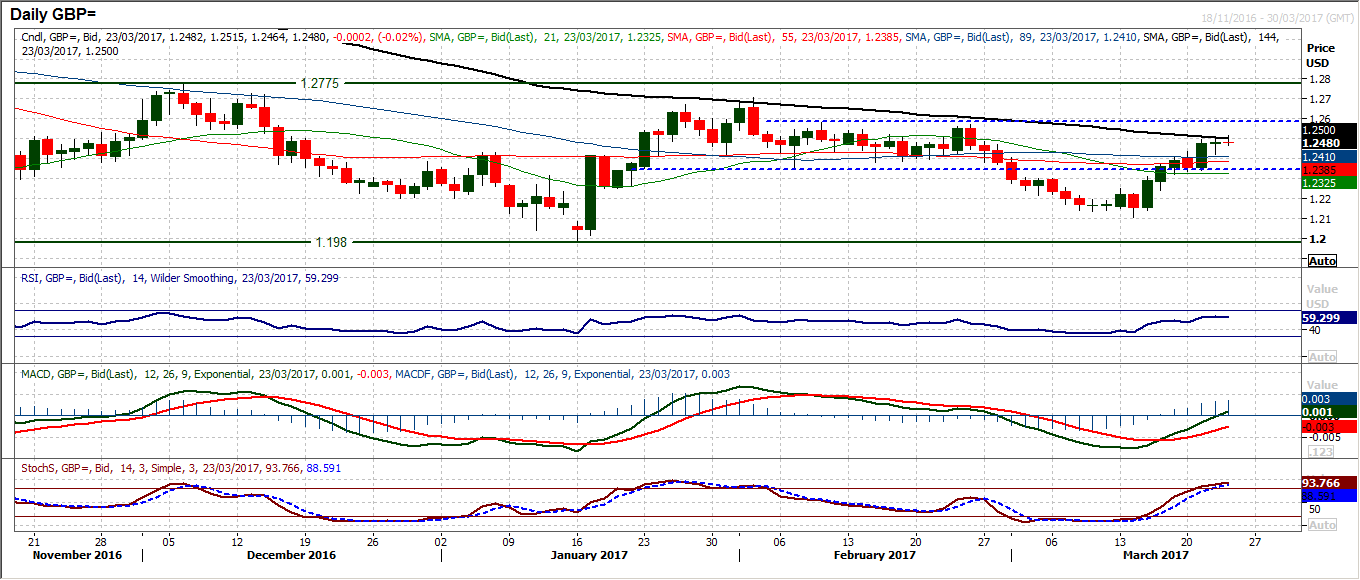
It would appear that the latest terrorist attack to hit western democracies is doing little to deter the recent rebound in sterling. The bulls are still in control near term on Cable as the market has now rallied through minor resistance at $1.2485 and now brings it into range of the key February range highs of $1.2570/$1.2582. This is a recovery play within the medium term trading range and the fact that previous key lows have not come into play as bearish overhead supply, would suggest that playing the full range now becomes a very viable option. The improvement in the momentum also suggests that, with the RSI above 60 and Stochastics rising into strong bull territory, there is little reason to think that $1.2582 will not come under serious scrutiny. Ultimately I still see this as a range play and do not expect the $1.2775 high to be breached. However the strength and consistency of this recovery phase shows no sign of stopping yet and with these rallies tending to last for between two to three weeks during this range, there is further to go. Support is initially now $1.2420 with $1.2380 and then $1.2320 being key.
USD/JPY
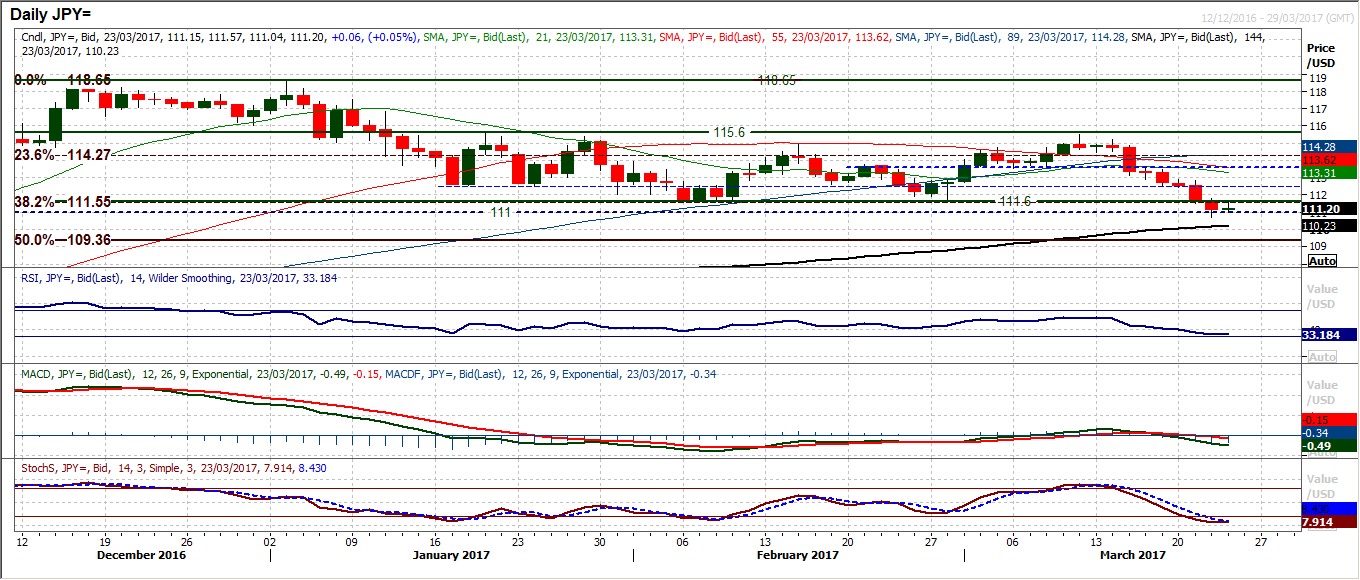
Dollar/Yen has broken below a key level of support at 111.60. This completes a downside break from the two month 400 pip trading range between 111.60/115.60 and implies further corrective move in the coming months perhaps towards 107.60. There is a bearish bias towards dollar yen now with this breakdown and the market continuing to trade below 111.60 will increase expectation of a corrective move. The breakdown is already this morning becoming a basis of resistance, however there is now a sell-zone between 111.60/112.50 for any recoveries. Momentum is bearish and a close below 111.00 which is a long term pivot would just add to the negativity. Initial support is now yesterday’s low at 110.70.
Gold
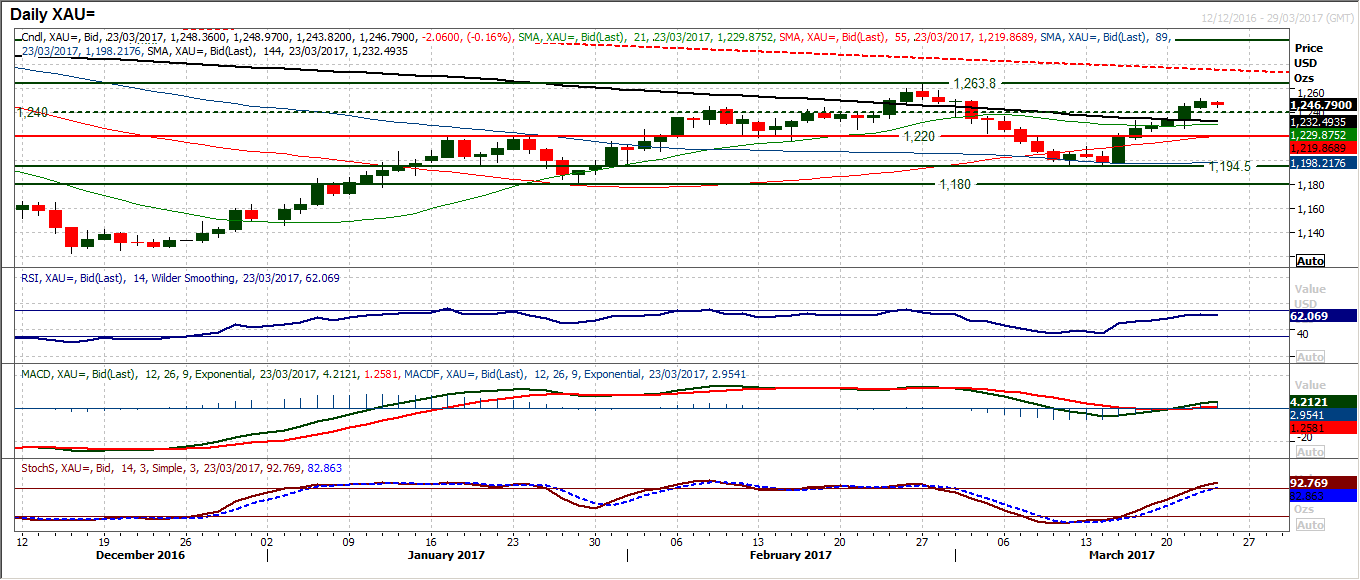
The rally on gold is now six bullish candles and counting. The move through the old overhead supply of $1240/$1245 now means that a full retracement back to $1263.80 is perfectly possible. The momentum indicators are positively configured near term for the recovery to continue with the RSI above 60 and the near term bulls are in control. Whether this turns into something more than just another recovery within a medium term ranging phase remains to be seen though with such a key long term downtrend falling currently at $1275. The hourly chart shows the stepped advance and momentum being positively configured to use intraday corrections as a chance to buy. Initial support is $1242.50 before the $1235.50 breakout support. The reaction low at $1226.30 is now key.
WTI Oil
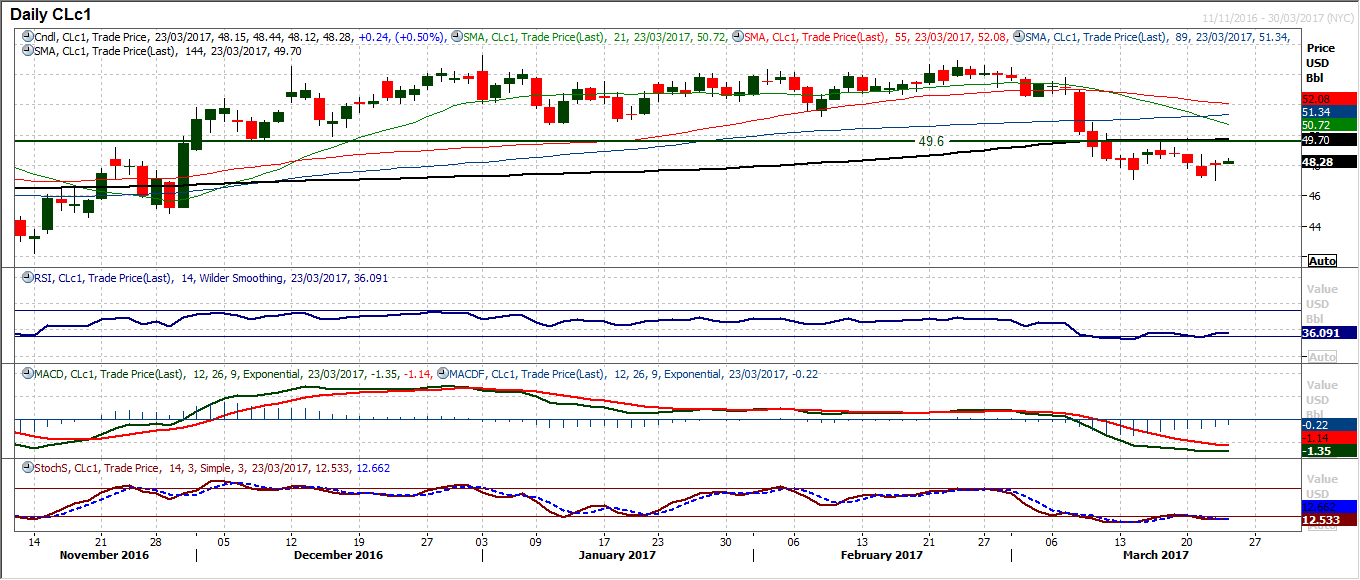
Despite the technical rally formed yesterday, the sellers remain in control of the oil market. Although an intraday rally meant that oil closed well off the lows of the day, rallies will continue to be seen as a chance to sell. Another concerning rise in EIA crude oil stocks may have been slightly tempered by a larger than expected drawdown in distillates and gasoline stocks, however this does not hide the increasing US oil production and inventories which will hamper gains on oil now. On the technical, the run of lower highs may have been broken by an early gain today, but momentum indicators remain bearishly configured and the near term resistance is prohibitive to a rally at $48.75 under the $49.60 key rebound high. A retest of the lows around $47.00 remains likely in due course.
Dow Jones Industrial Average
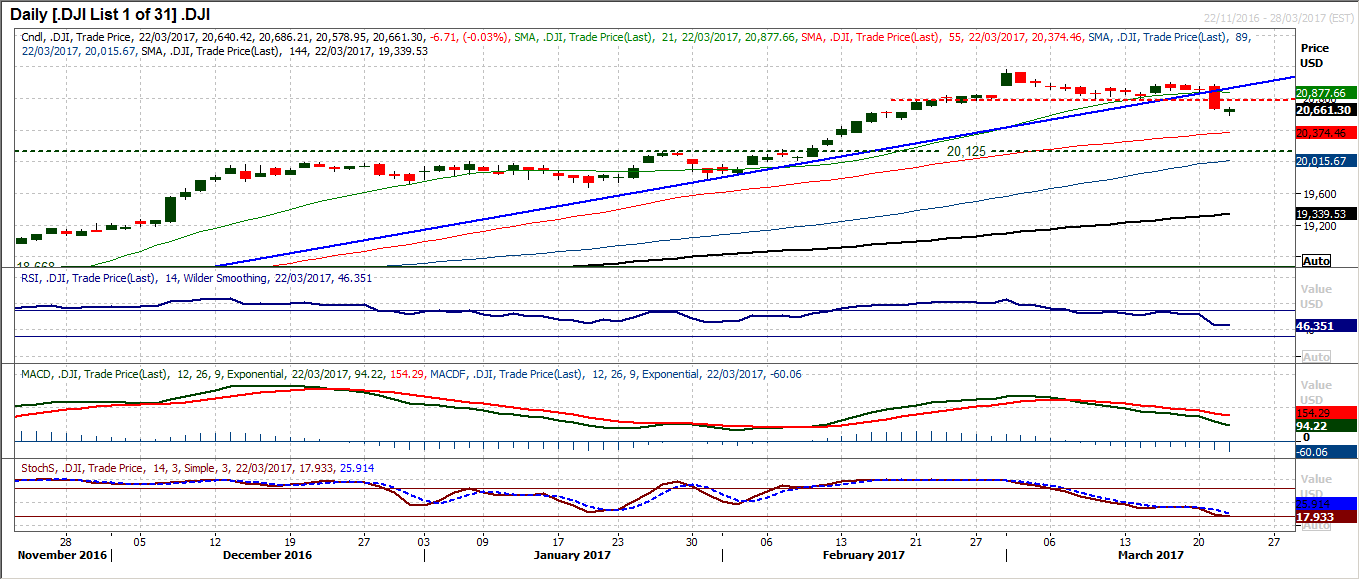
The outlook for Wall Street deteriorated with yesterday’s sell-off. A break below 20,777 completed a small top pattern that implies a minimum of downside of 20,555 which is still in play as a near term implied target. Momentum indicators are tracking lower now with the daily RSI currently at its lowest since November, MACD lines accelerating lower and the Stochastics also bearishly configured. The broken uptrend top pattern and corrective momentum indicators now mean that the near term bears are controlling the market. Furthermore, with a lower high posted at 21,000 the potential for a near to medium term bear phase is building. The breakdown of 20,777 becomes a basis of resistance now and it was interesting to see the market forming a mild consolidation candle yesterday, but rallies will now be viewed as a chance to sell near term. Support is initially at yesterday’s low of 20,579 before 20,532 whilst the old breakout at 20,125 is the first real support of any significance.
Author

Richard Perry
Independent Analyst


