Risk appetite slips as the Fed remains on track for tightening

Market Overview
The FOMC meeting last night did very little to change the outlook for rate hikes. However, it was interesting to see that a more hawkish Fed chair (Powell over Yellen) seems to be willing to look past recent market volatility, which did not even get a mention. The slight hawkish tweak to the language on unemployment and nods to what should now amount to a guaranteed rate hike in December (barring a black swan event). Market reaction to the Fed has been to pull back on risk, with the shorter end of the Treasury yield curve to rise and the dollar to strengthen. Furthermore, the announcement has just given the yen renewed impetus, whilst equity markets have pause for thought after the exuberant initial reaction to the mid-terms. This is all reflecting a drag on market sentiment with a nod to a more risk averse outlook in this morning’s moves on forex majors. There could also be an element of a nod to this from the China inflation data overnight, which showed that factory gate inflation continues to slip back in a hint of economic slowdown. China’s CPI was in-line with expectations (+2.5% exp, +2.5% last) whilst PPI dropped back to 3.3% (+3.3% exp, +3.6% last).

Wall Street closed mixed last night in the wake of the Fed meeting, with the Dow mildly higher (by just 10 ticks) whilst the S&P 500 closed -0.3% at 2807. Asian markets were hit with the Nikkei -1.1%, with the Shanghai Composite -1.4%, whilst European indices are just under half a percent lower in early moves. In forex, there is a risk averse outlook with the dollar stronger across the major pairs, with the yen outperformance being the big mover. In commodities, the slip on gold continues, whilst oil is lower yet again this morning, despite WTI falling into bear market territory (Brent Crude is not quite there yet).
Traders will be focusing on UK economic growth this morning, with the prelim reading of UK Q3 GDP at 0930GMT. Consensus expects GDP to have improved by +0.6% in Q3 (up from the +0.4% growth in Q2). UK Industrial Production at 0930GMT is expected to have slipped by -0.1% on the month, whilst the year on year reading is expected to have grown by +0.4%. US factory gate inflation is a focus into the European afternoon, with the US PPI released at 1330GMT where the headline PPI is expected to be +2.5% (down from +2.6% last month), whilst core PPI is expected to have slipped to +2.3% (from +2.5% last month). The prelim University of Michigan Sentiment is at 1500GMT which is expected to show a slight dip to 98.0 (from the final downwardly revised 98.6 last month).
Chart of the Day – GBP/JPY
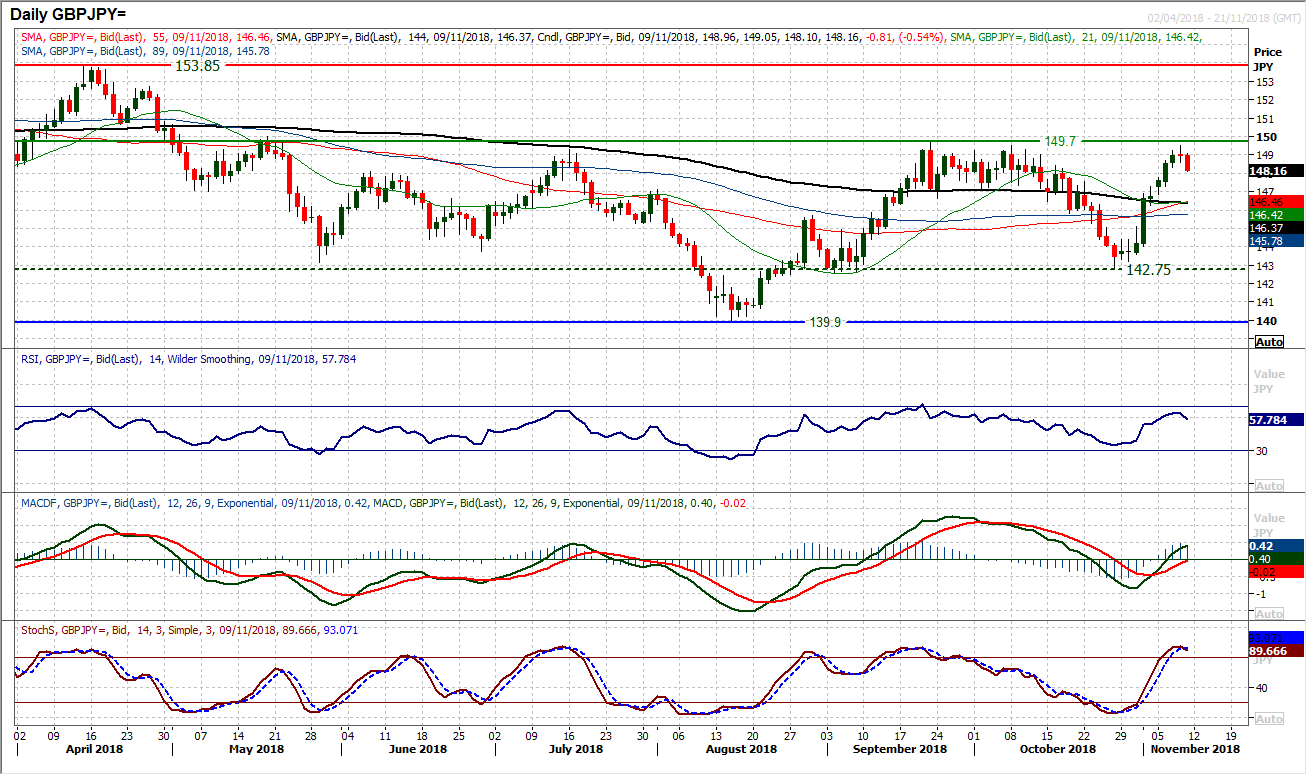
With the improvement in risk appetite over the past week on global markets and the chatter about a Brexit deal in the offing, there has been a weakening of the yen and a strengthening of sterling. This has all played out in a rally on Sterling/Yen from a late October low at 142.75 to complete an about turn and pull the pair back towards a test of near six month highs. However, the sterling bulls are struggling to make the breakout. The 149.70 resistance of the September high marks a level that the medium term bulls will deem as key to a continued recovery (a two day closing break is needed above 149.70 to confirm what would be a six month “head and shoulders” base pattern. However, the bulls are stuttering now after yesterday’s very slight loss on the day ended a run of six consecutive bull candles. The early decline today leaves the market at risk of a three candlestick “evening star” pattern (solid bull candle in, doji, solid bear candle out). This would be a reversal signal that would add further strength to the already key resistance at 149.70. Momentum indicators are already beginning to roll over, with the RSI back below 60, and the Stochastics threatening to turn down. For clues of a growing correction, the hourly RSI has dropped below 40 and MACD lines below neutral. Support is initially at 148.30 with 147.30 and 146.85 further support now.
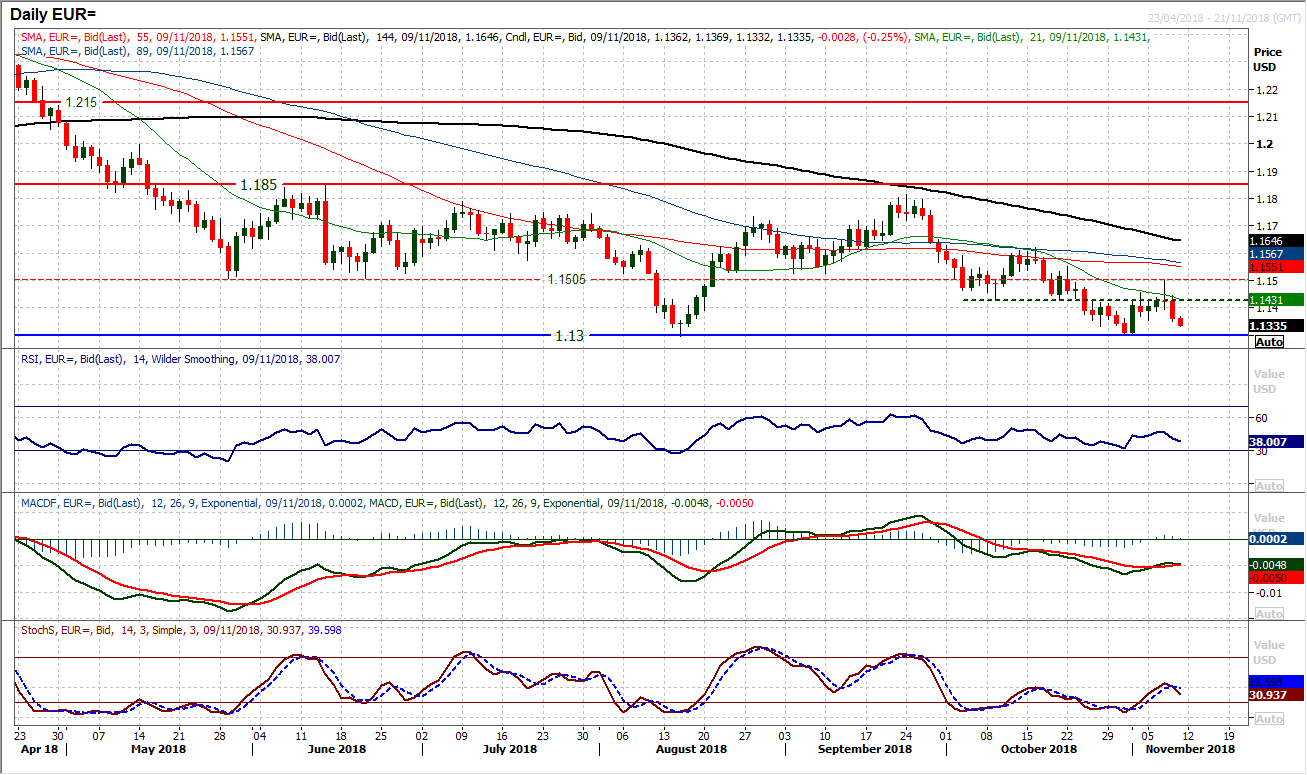
As EUR/USD begins to track lower again, it seems as though it is one of the major pairs that is especially vulnerable to renewed dollar strength. Yesterday’s decisive bear candle dragged the market over 60 pips lower and back within range of the crucial $1.1300 support again. The bulls failed at the $1.1500 key pivot area on Wednesday and having seen the minor higher low support at $1.1355 being breached, with the selling pressure continuing today the market is tracking towards a test of the key floor $1.1300 which supported the market in August and the end of October. Trading below all the falling moving averages, whilst the momentum indicators are also rolling over with renewed downside potential there is a real risk of $1.1300 being breached. This would be a 16 month low and open the next support at $1.1100. The hourly chart shows $1.1355/$1.1395 is now overhead supply for a rebound, and intraday rallies are now a chance to sell.
After a period of just over a week where they had fallen out of favour, the dollar bulls are fighting back again and Cable is being dragged lower. The recent recovery has taken the market into the upper half of a four month trading range between $1.2660/$1.3400, so the 23.6% Fib level (at $1.3065) and the pivot area $1.3040/$1.3050 will now be a gauge as to how the near term outlook is faring. Is these levels fail and the market closes back below the psychological $1.3000 level, this could begin to drive momentum in a renewed correction. The Stochastics have already started to roll over, whilst the MACD lines are threatening the same under neutral. The hourly chart shows that in the least the bulls have lost control and there is now resistance around $1.3090 as a minor pivot. Below $1.3000 opens $1.2950 initially but the corrective momentum would be such that further downside targets towards the bottom of the range would open again.

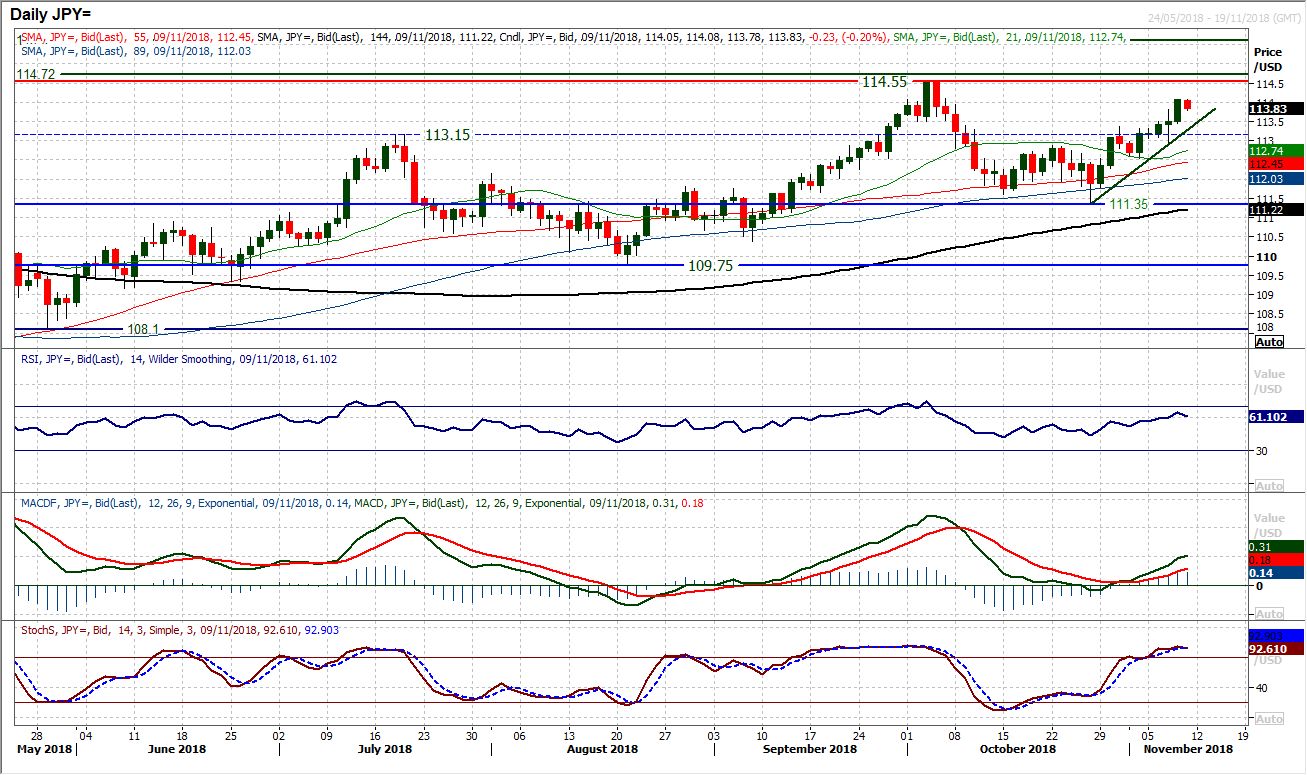
There seems to be little to stand in the way of Dollar/Yen pushing higher towards a test of 114.55 as another decisive bull candle was posted yesterday. Daily momentum indicators are increasingly strongly configured with the RSI pushing into the 60s (the highest since the 114.55 peak) whilst the MACD lines are accelerating higher and the Stochastics strongly configured. The uptrend that has formed over the past couple of weeks comes in as support now at 113.30 today which means that the underlying demand of the old breakouts between 113.15/113.40 are an increasingly strong basis of support now. Intraday corrections are a chance to buy meaning that today’s early slip back will be seen as an opportunity. There is initial support at 113.55/113.80, but expect yesterday’s high of 114.10 not to last long.
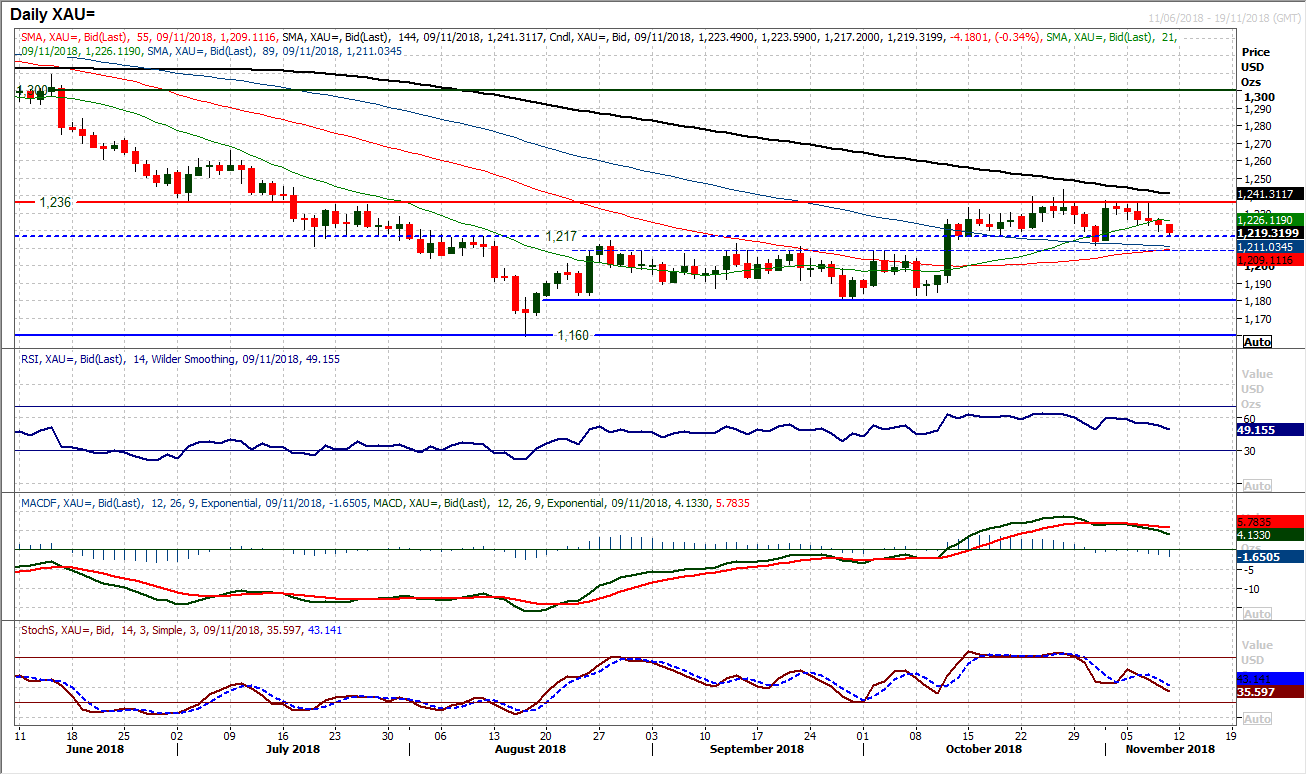
The market continues to trade within the near term range as the Fed did little to shift any expectations. With a more positive appetite to risk, there has been a slip back over recent sessions, but this is likely to provide the next opportunity. The run of slightly negative candles may have started to pull momentum indicators lower but this is still within the context of a positive medium term configuration and is set to provide the next chance to buy. Support is based in the range of old highs between $1208/$1217 which is a source of underlying demand is still expected to provide the basis of support for the next move to put pressure on the resistance at $1236. A renewed buy signal above $1211 would be a signal the bulls are waiting for.
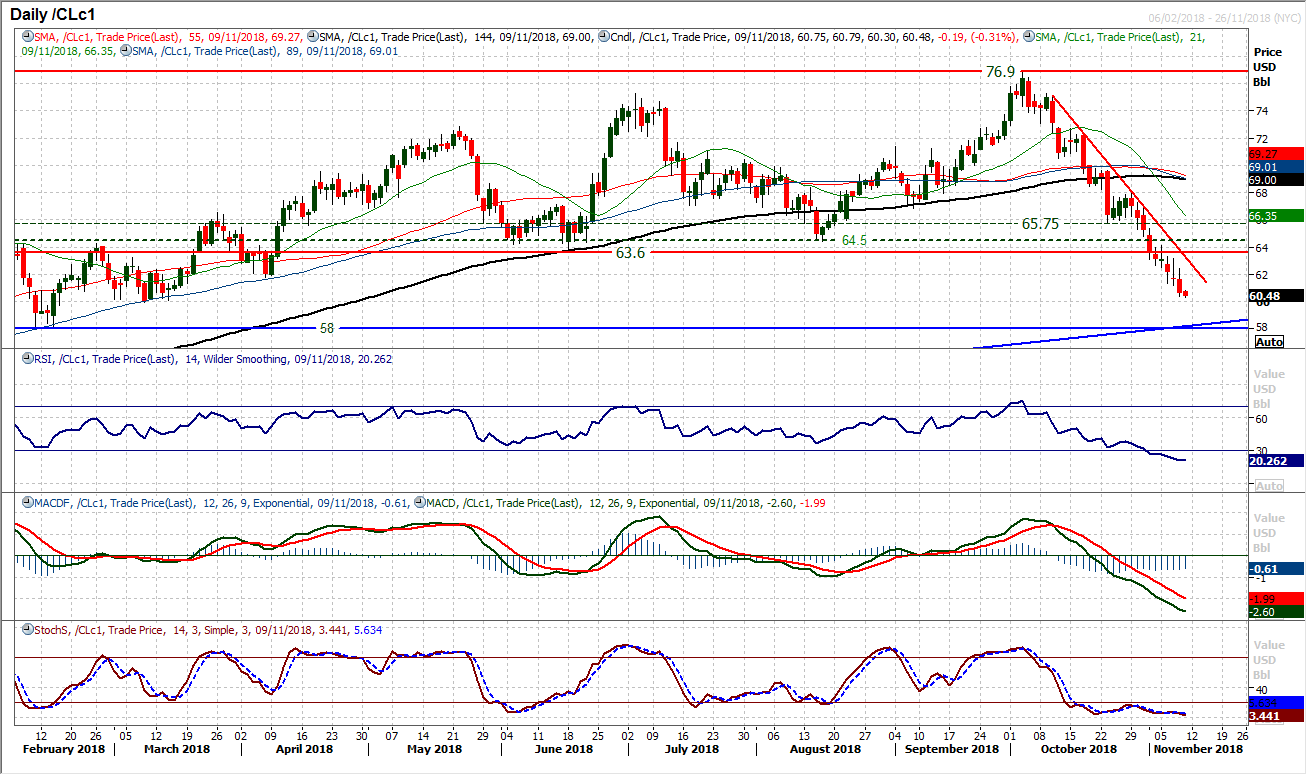
WTI Oil
The trend lower seems well set as the momentum of the sell-off continues to eye a test of the key lows at $60.00 and potentially $58.00. The RSI continues to fall further into strong bear territory, with the RSI extending its lowest levels since January 2016 (when the market posted its key long term low below $26). WTI has now fallen from the $76.90 high to below the $61.80 support with a fall now of over 20% which means that WTI is now in official bear market territory. The only caveat to the extremely negative position on momentum is that the chances of a snap back technical rally are growing by the day. However, there is now significant overhead supply at $63.60/$64.50 whilst the resistance of a four week downtrend comes in at $63.25 today meaning that rallies will still be seen as another chance to sell. The next support to be tested is the March low at $60 whilst the February low of $58.00 is the next key low. The hourly chart shows a stream of lower highs, with the falling 89 hour moving average a basis of resistance. The first level to watch is therefore $62.45 (yesterday’s high), with $63.20 subsequent resistance.
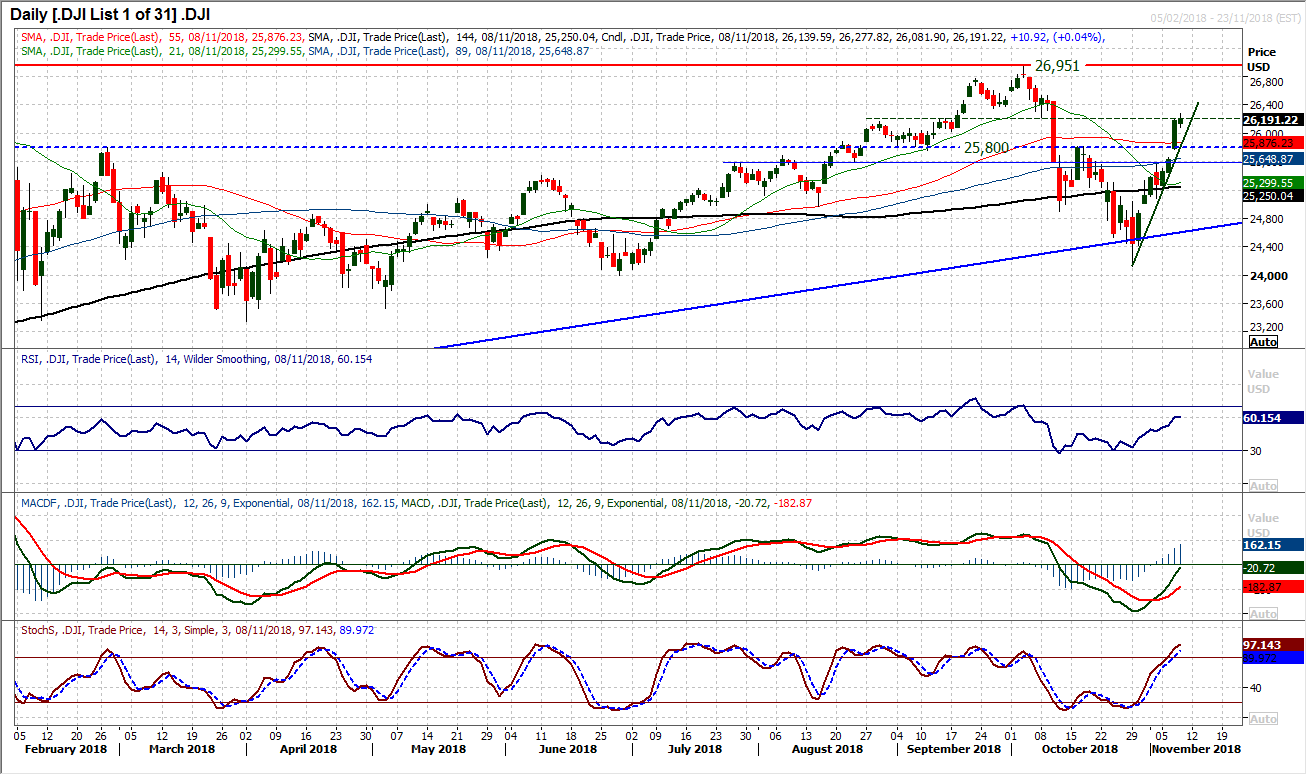
Dow Jones Industrial Average
The Fed meeting may have given Wall Street pause for thought, but as yet there is little to be overly concerned about on a technical basis. The uptrend recovery comes in to support the market now at 26,020 which is above the near term pivot at 25,800 whilst the momentum indicators continue to track higher and suggest that corrections are a chance to buy. However, given that the hourly chart suggests that momentum is stretched, this increases the chances of a near term corrective slip. The hourly chart shows support in the band 25,580/25,820. Yesterday’s early session high at 26,278 is initial resistance.
Author

Richard Perry
Independent Analyst


