Risk appetite plunges further as a crucial Fed meeting looms

Market Overview
Market sentiment and appetite for risk continues to plunge as the final meeting of the Federal Open Market Committee looms. As things stand, markets are almost trying to force the Fed’s hand in taking a step back in its monetary tightening. There is a gaping divide between what the market is pricing for rate hikes in 2019 and what the Fed is currently showing in its forward guidance. The huge sell-off in equities is also playing into this narrative too and gives the Fed a massive decision to make. With volatility so high, there could be some wild swings in markets in the coming days. If the Fed hikes (almost guaranteed) and holds firm in its dots, then there could be a plummet on equities, but also could drive an inverted yield curve (2s/10s spread is currently 16 basis points). However, equally, expectation has become so stretched, that if the Fed does scale back to meet the market, there could be a significant dollar correction and sharp rebound on equities. For now the likes of EUR/USD and Cable are relatively steady in wait and see mode, whilst the huge risk aversion is helping the safe haven plays such as the yen, Swissy and gold. Treasury yields are also falling away. December is looking like it is going to be a terrible month for risk, but this could all change if the FOMC yields in its tightening.

Wall Street shed another 2% yesterday, breaking massive supports at 24,000 on the Dow and 2580 on S&P 500. The S&P 500 was down -2.0% at 2555 whilst futures are just a shade higher by +0.1% today. Asian markets have been similarly under pressure (Nikkei -1.8%, Shanghai Composite -0.8%) whilst European markets are also under pressure early, with FTSE 100 futures -0.8% and DAX futures -0.5%. In forex, there is mixed outlook with the yen still performing well, but also the New Zealand dollar too after positive business confidence numbers. In commodities, there has been a consolidation on gold and silver, whilst the breakdown on oil to new multi-month lows seems to be gathering pace this morning.
As for the economic calendar, traders will be looking out for the German Ifo Business Climate reading at 0900GMT as it has close correlation with German growth and subsequently the Eurozone. Consensus expects a further slip to 101.8 (from 102.0) which would be a fourth consecutive month of deterioration. In the afternoon, the US Building Permits are at 1330GMT which are expected little change at 1.26m (1.26m last month) and Housing Starts which are expected to remain at 1.23m (1.23m exp).
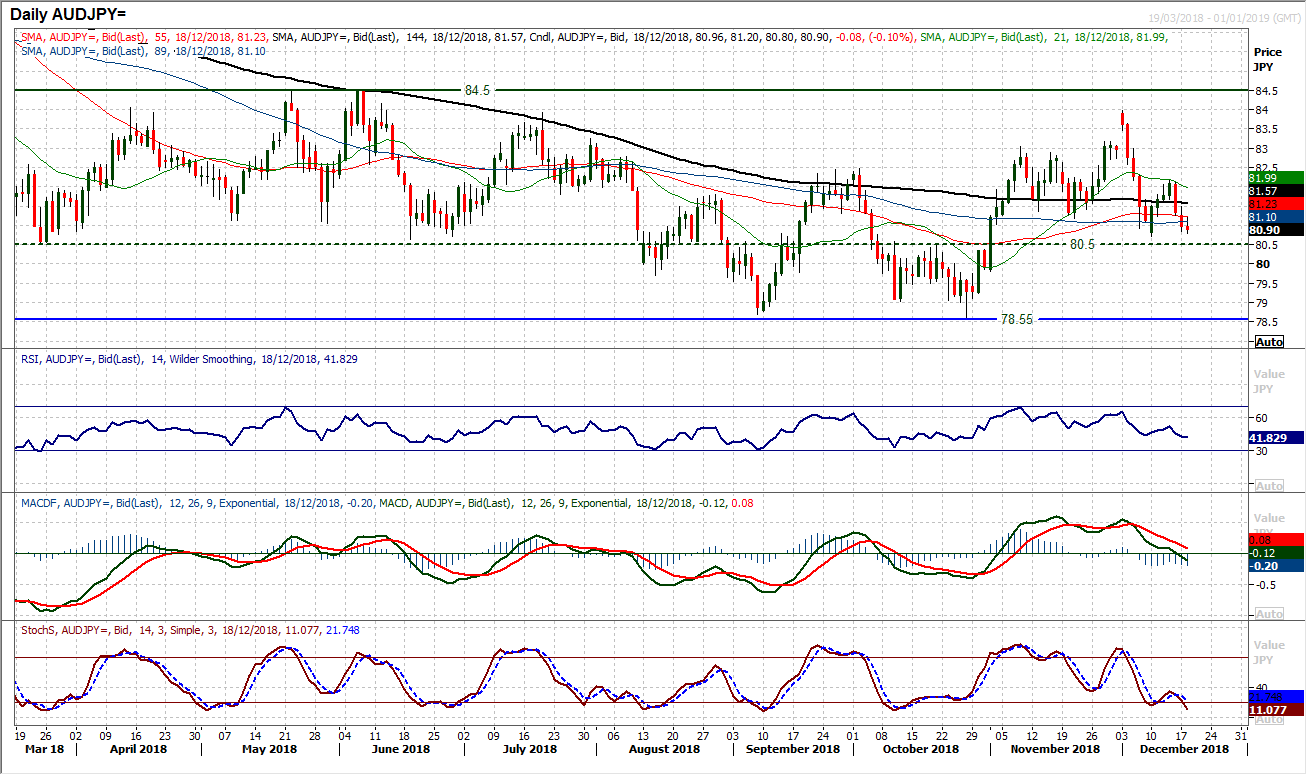
Chart of the Day – AUD/JPY
This cross is a good reflection of risk appetite, with the Aussie under pressure as the yen performs well across the majors. This is subsequently driving AUD/JPY lower and leads to the lowest close in six weeks. Momentum indicators are already deteriorating strongly now with the Stochastics turning back lower from an already negative configuration, MACD lines accelerating lower, and the RSI also increasingly correctively configured. There is a reaction low from early December at 80.70 which looks now to be tested, whilst on a medium term basis a pivot is in place at 80.50. With the deterioration in the past couple of sessions there is now a lower key high at 82.20. The hourly chart is negatively configured with bearish signals on the hourly MACD and RSI specifically. The hourly chart shows resistance at 81.20/81.60 as a near term sell-zone today.
EUR/USD
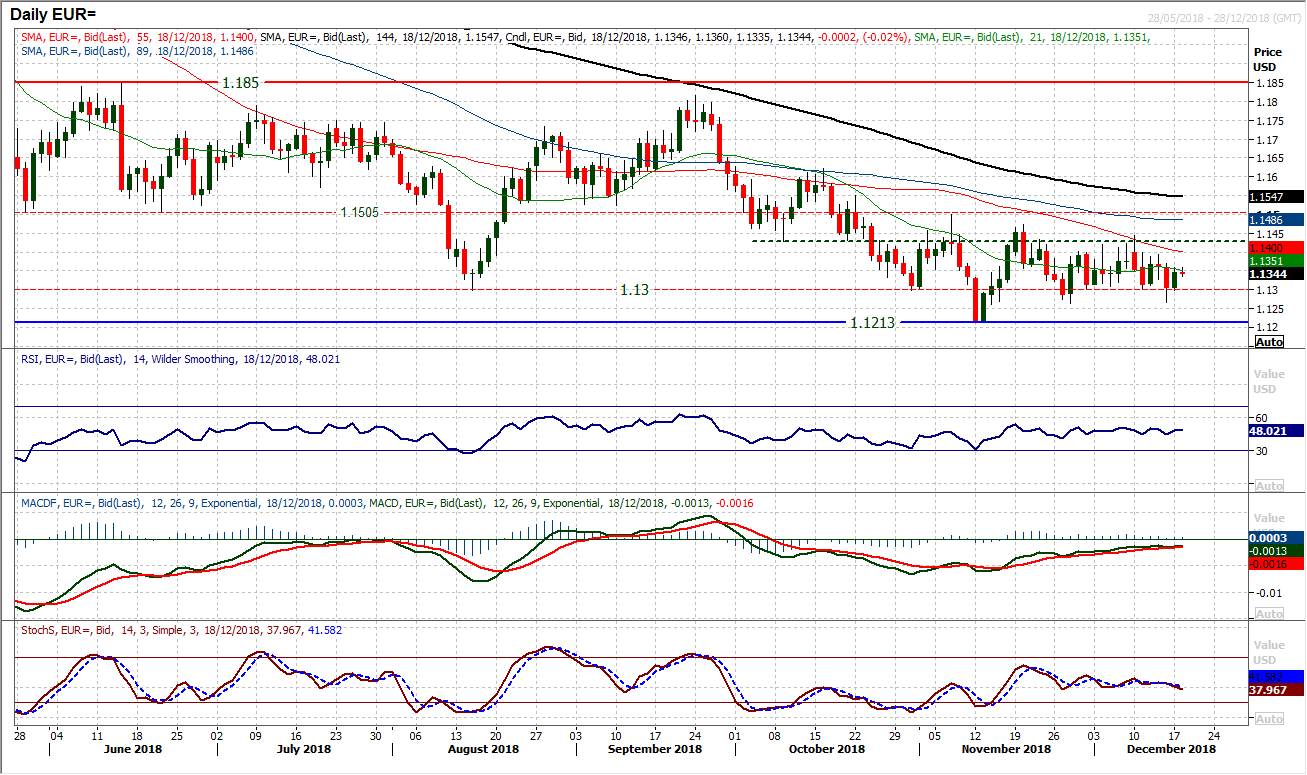
The sense of near term consolidation continues to build as the buyers have come in to support in the band $1.1265/$1.1300. Yesterday’s positive candle has all but unwound Friday’s decline and the bulls are still hanging on to their potential recovery. However, there is still a medium term negative bias which is an impediment to a sustained rally. The concern is that the momentum indicators are showing signs of being tired, with the Stochastics beginning to edge lower again whilst the MACD lines are losing their recovery impetus. Nothing really changes on EUR/USD until a closing breach of $1.1265, or a close above $1.1445 however there is more of a negative slant that is beginning to take hold. The hourly chart shows near term negative signals on hourly MACD lines and hourly Stochastics which could increase the pressure lower today.
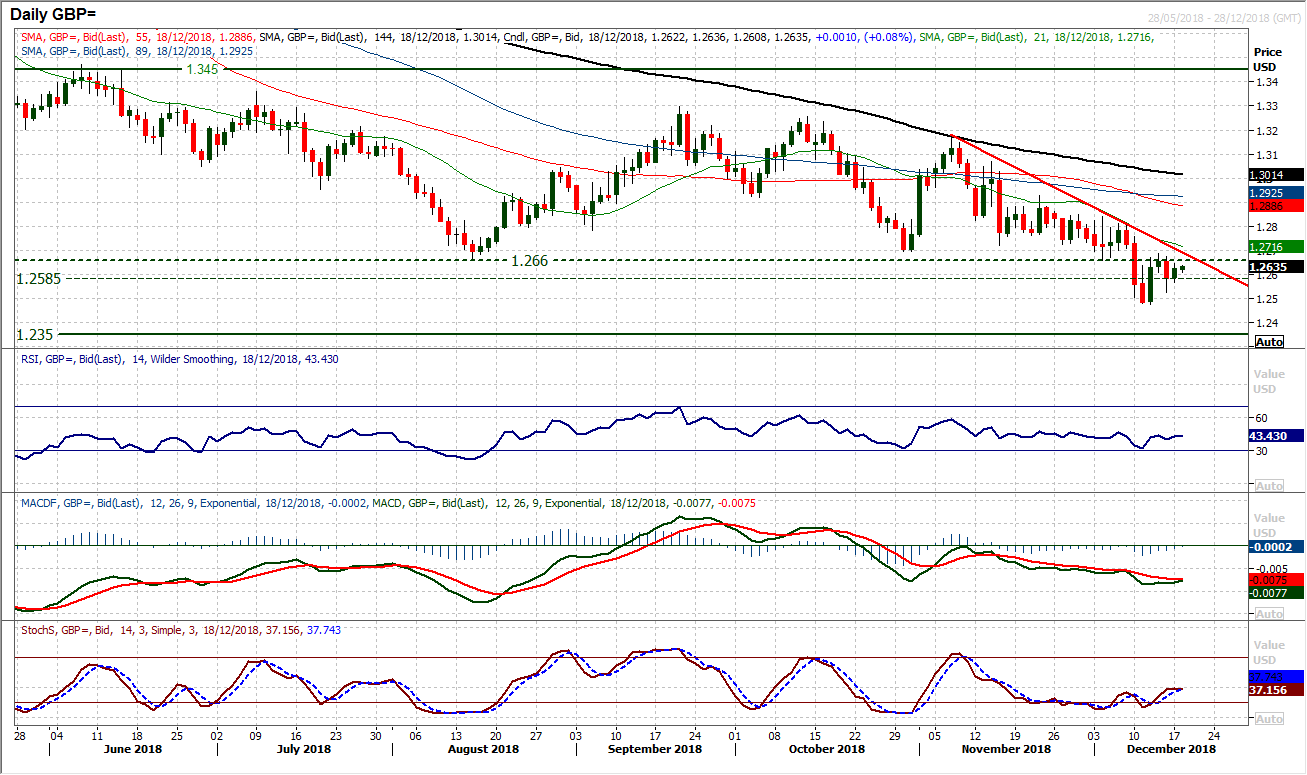
It was interesting to see that Cable has not accelerated lower following Friday’s decisive negative candle. The fear was that the overhead supply around $1.2660 would kick in and the market sell sharply down once more. However, there has been a degree of consolidation that has looked to form early this week. This comes (aside from the FOMC looming large tomorrow) as the market now drifts towards the confluence of resistance in the $1.2660 pivot, the five week downtrend (today at $1.2690) and the 21 day moving average (at $1.2715) which has been a basis of resistance in the past month. A calming of the momentum indicators has also begun to take shape. Near term levels are resistance at $1.2660/$1.2685, with support of Friday’s low at $1.2525 above the key low at $1.2475.
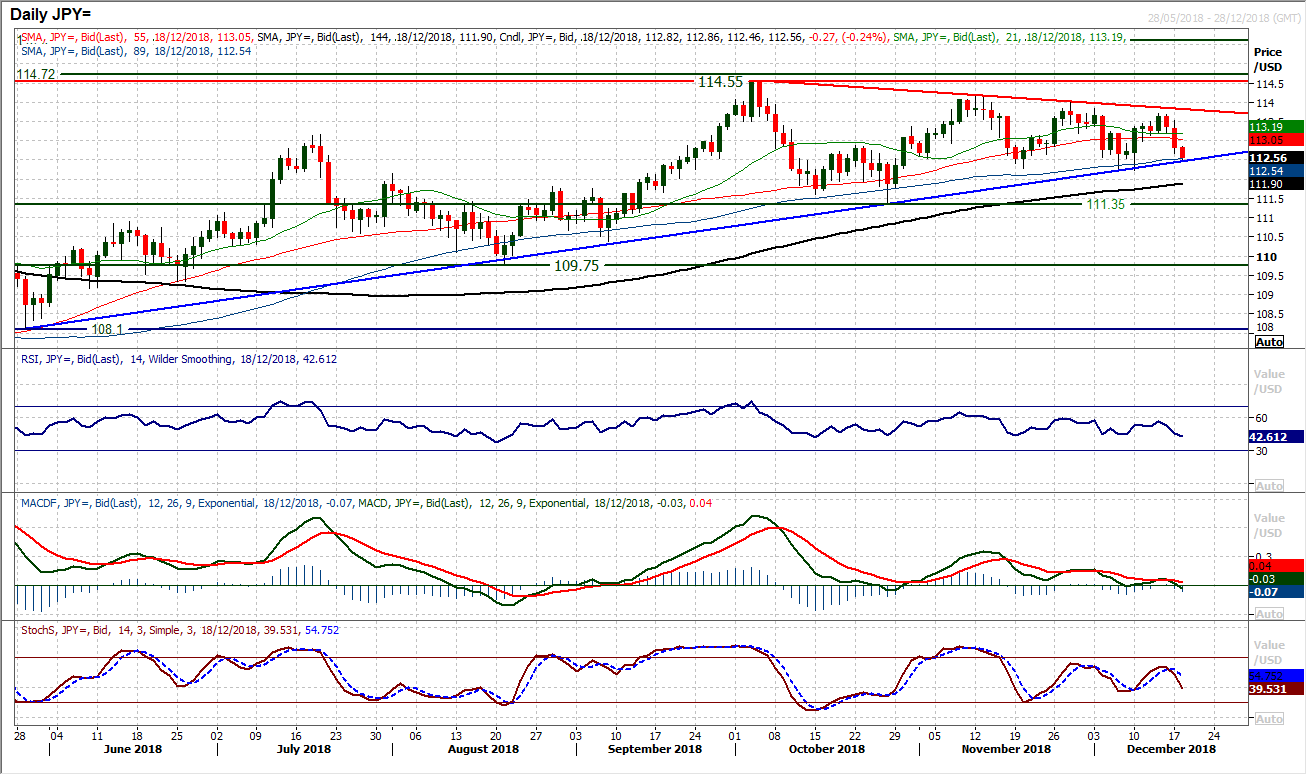
Once more the dollar rebound lost traction yesterday and the medium term consolidation pattern continues to dominate. The six month uptrend has been met with a ten week downtrend as a consolidation triangle has formed, with another failure and lower high at 113.70 adding to this period lacking direction. Momentum indicators reflect this too, with the RSI back under 50, MACD lines turning back lower and also the Stochastics crossing lower too. A further slip today is now eyeing a test of the six month uptrend support (today at 112.45), but also the 89 day moving average (today at 112.55) which has been the basis of support on several occasions since August. Support at 112.20 is key and a closing breach would be a signal to suggest not only the dollar bulls had lost their strength but also sizable risk aversion. Negative signals include daily RSI below 40 and MACD lines accelerating below neutral.
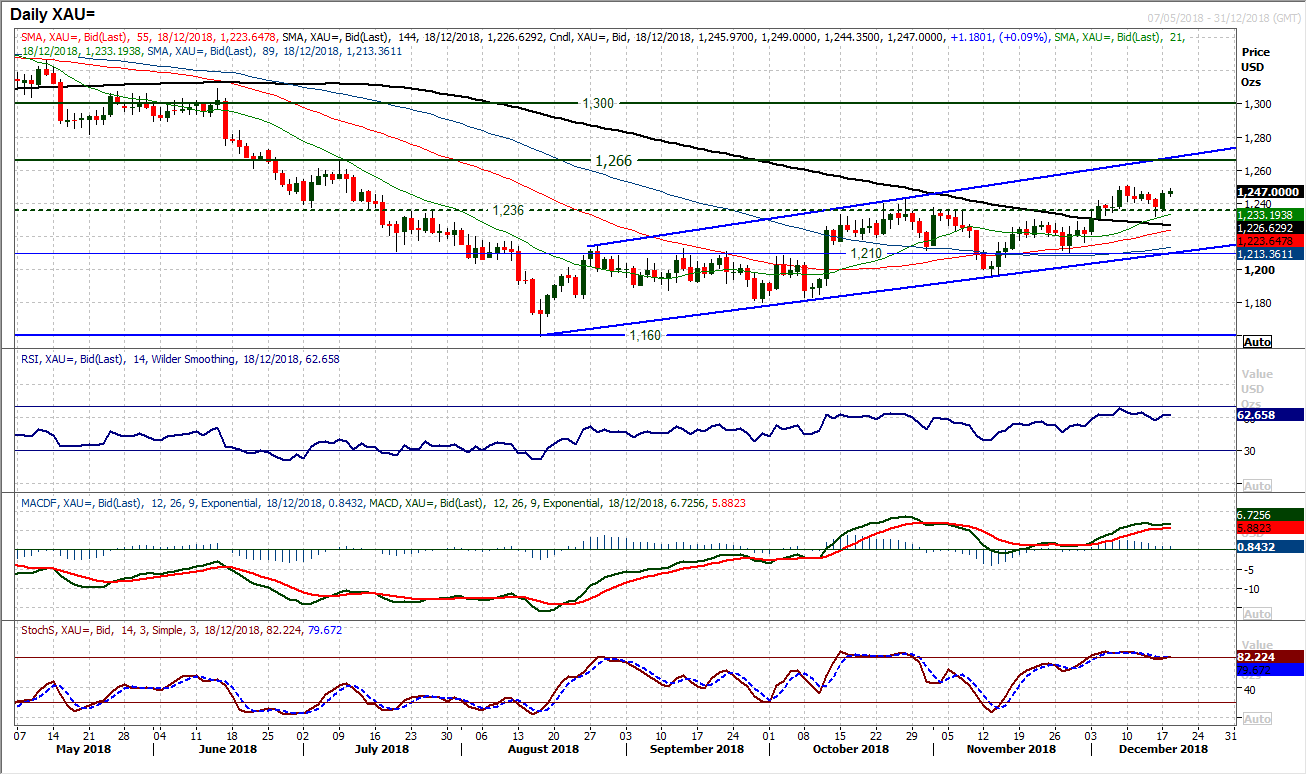
Gold
After the negative drift of the past week, the gold bulls looked to take back control yesterday with a decisive positive candle. The interesting feature of the recent moves has been that the market has used the pivot at $1236 as a basis of support. Where we saw in October/November the market could not close above the $1236 pivot which was resistance, we now see the pivot acting as key support and the market is not closing below. The importance of this will grow the longer it lasts for. The bull move yesterday now puts emphasis on the resistance at $1250 again. The market has already had one look this morning, but a close above $1250 opens $1266 again. Momentum indicators which had threatened to roll over are now looking to find renewed traction again. A move above $1250 would also make Friday’s low at $1232 another higher low.
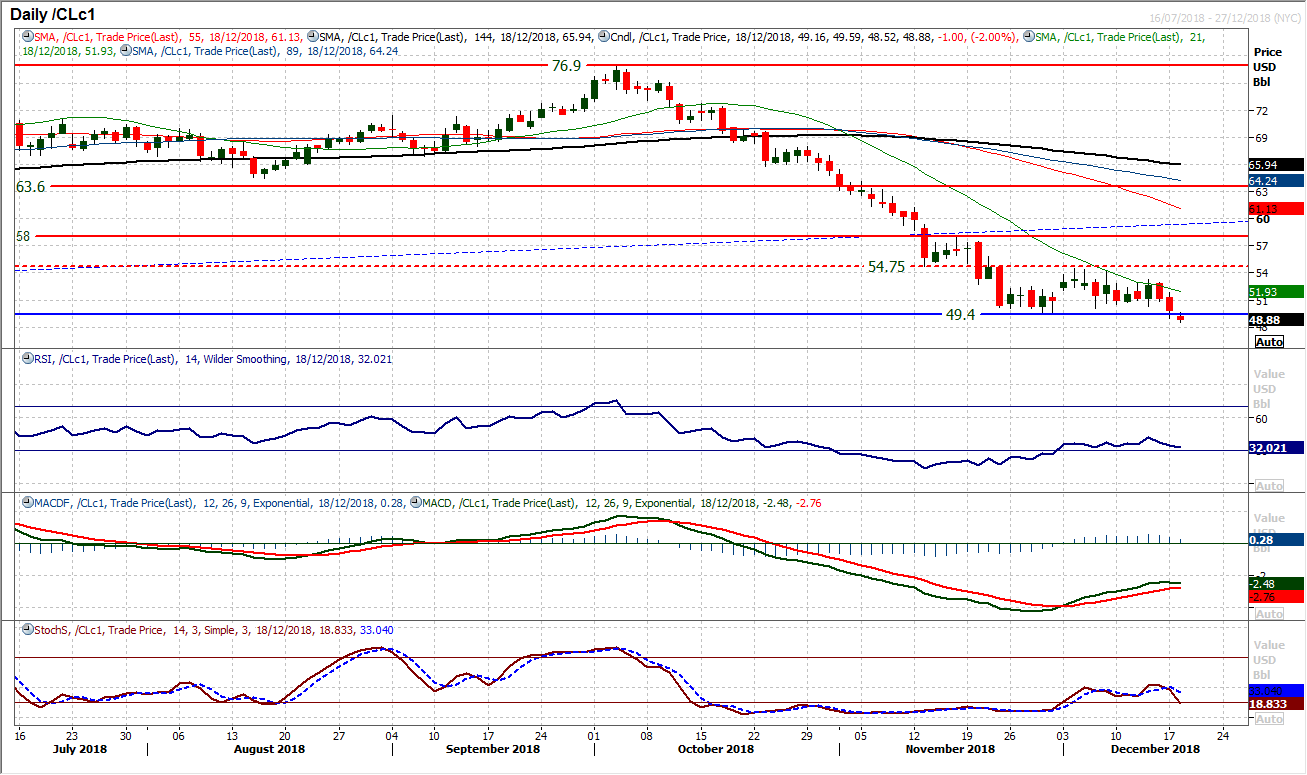
WTI Oil
Risk appetite under pressure and oil has dropped back again. With a second decisive negative candle in a row, the support of the recent consolidation has now been broken, albeit on an intraday basis for now. This is a warning to the bulls and means that today’s session could be critically important. A third consecutive bear candle with a close below $49.40 would complete a range breakdown and imply around $5 of further downside in the coming weeks. Momentum indicators are beginning to deteriorate and the Stochastics are leading the way. Today’s session shows that $49.40/$50.50 is now a basis of resistance and unless the bulls can break back above this quickly, the downside break would be confirmed. There is minor support at $47.00 with the next key low from August 2017 at $45.60.
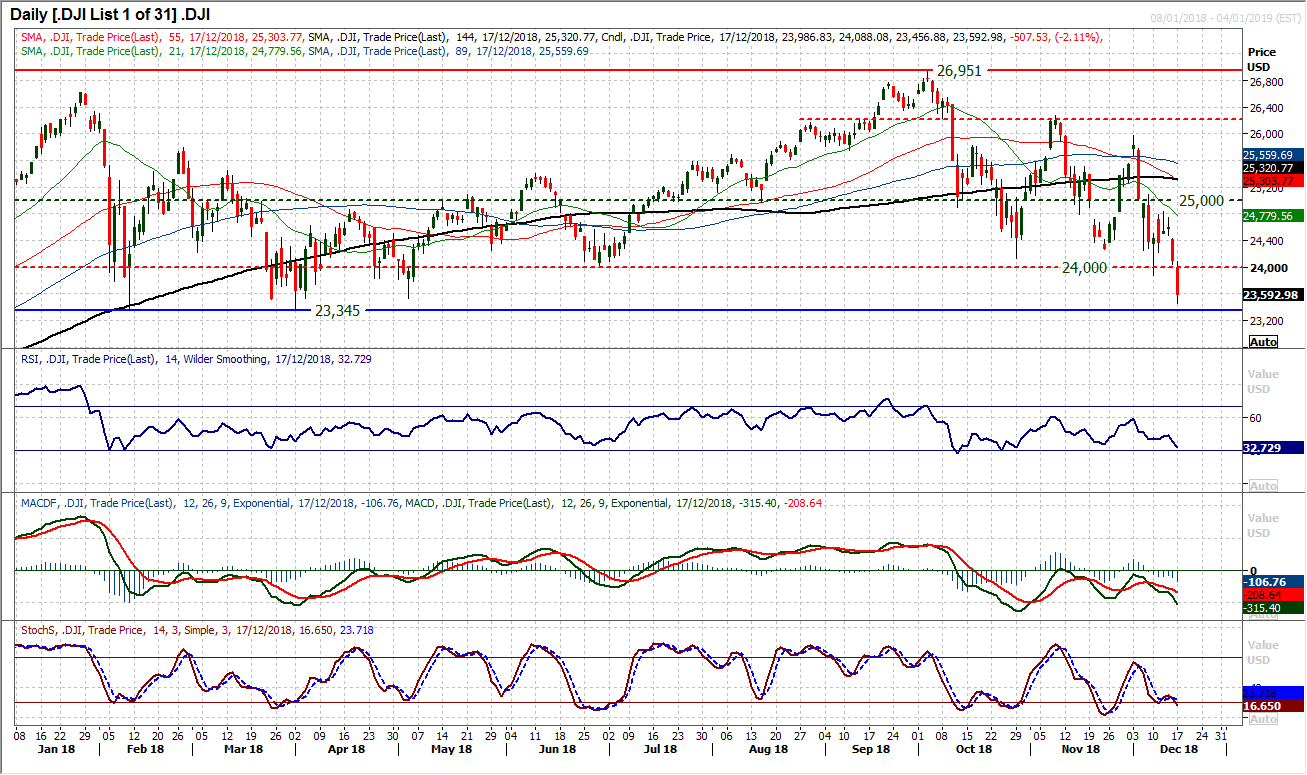
Dow Jones Industrial Average
Another huge day of selling has taken the Dow below 24,000. On several occasions in recent months, this has been the basis of a floor that has formed support for rebounds. However, this time has proved to be too much and a huge bear candle has smashed the support to take the Dow to its lowest level since May. The next key support is at 23,345 which is the 2018 low from April and really is a critical support. A breach of 23,345 would complete a massive top. Momentum indicators are bearishly configured but also deteriorating. Throughout 2018, the RSI has consistently used 30 as a stretched level t induce a rally (once going to 26 before a rally kicked in) but the bearish configuration across momentum is a concern for this being a big trending move. The old support around 24,000 becomes a basis of resistance now.
Author

Richard Perry
Independent Analyst


