Risk appetite deteriorates amid US/China dispute and rising German political risk

Market Overview
Question marks over protectionism and the impact on global growth have pushed back to prominence on the list of risk factors for traders as the trade tensions between the US and China ratchet up again. The US has announced a list of $34bn of goods from China that will be subject to tariffs of 25% from 6th July. This could also increase to $50bn in total on further review. China has retaliated with $34bn of its own tariffs on US goods. Whilst the number seem to be relatively rather small for now, the US is likely to retaliate further and the issue promises to escalate further. Financial markets are reacting negatively to a continued dispute from which no-one wins, with risk appetite deteriorating. Major bond yields are falling back, whilst in currencies, the Japanese yen is in favour. Equity markets dropped sharply on Friday and remain pressured today, whilst the oil price is also continuing to fall with the prospects for global demand increasingly questioned but also the prospect of the OPEC meeting later in the week. One market that is not conforming to usual safe haven demand is gold, which finally suffered on Friday at the hands of a strengthening dollar. However, there is also an added political risk this morning in Europe, with the German Chancellor Merkel under serious pressure for her stance on immigration which could split her government in two. Watch for an impact on the euro (which is currently trading lower) and also the DAX.

Wall Street closed lower on Friday with the S&P 500 -0.1% at 2780 whilst Asian markets have responded lower, with the Nikkei -0.8% and European markets are mixed to lower in early moves and it will certainly be interesting to see the DAX underperforming on German political risk despite the weaker euro. In forex, the euro is slipping on increased political risk in Germany, whilst the safe haven yen is benefitting today. The dollar is mixed and this is helping gold to consolidated. However the oil price is now breaking lower once more with further weakness today on the trade tensions.
There is a light economic calendar today with just the NAHB Housing Market Index at 1500BST to really contend with. Consensus forecast is for the index to remain again at 70.
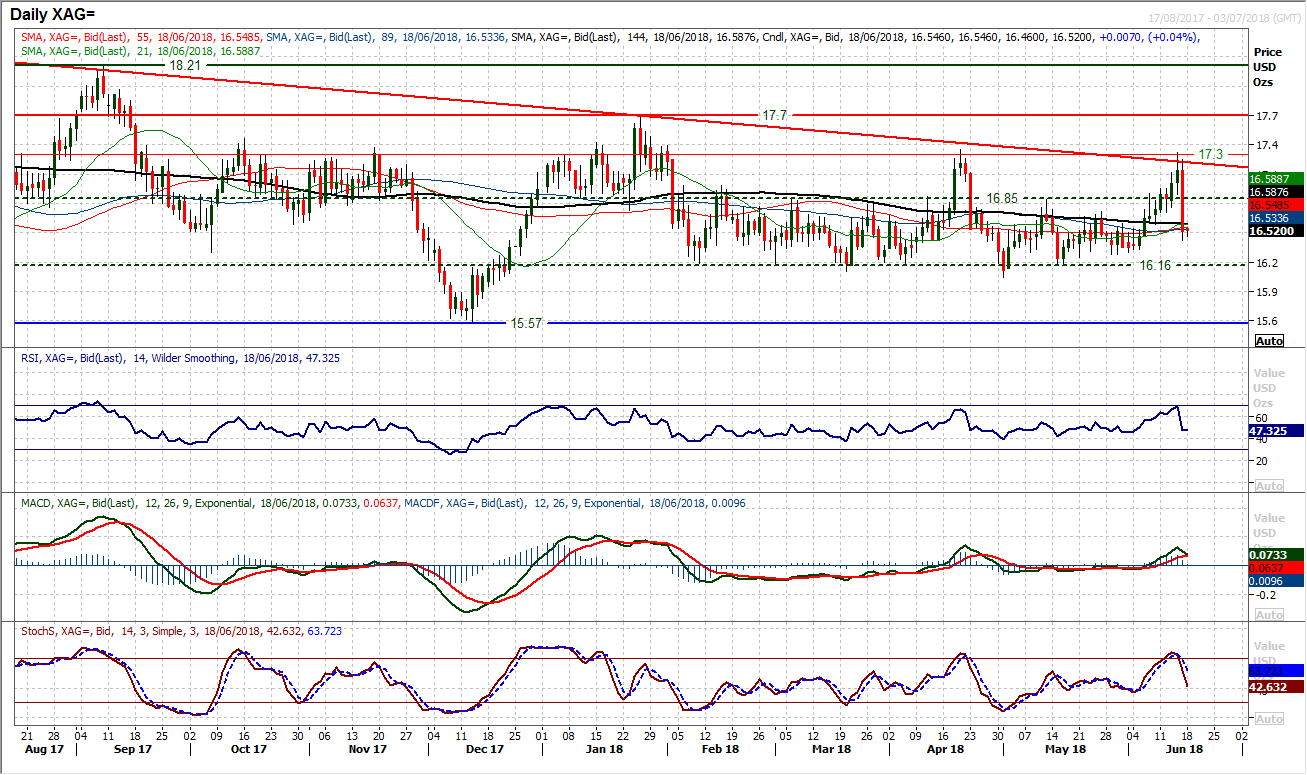
Chart of the Day – Silver
Yet another failure at the key long term downtrend means that silver has turned corrective lower once more and is open for yet another retreat back towards $16.16. Throughout 2018 the market has been supported time and again around $16.16 (with just two of the briefest of breaches) but this also remains a level that the price seems to be drawn towards. This now looks likely again as momentum indicators have turned corrective in the wake of Friday’s sharp bear candle. This suggests that the upside break has once again been a failed break, just as it did in January and April. On both occasions, the RSI peaked in the high 60s and the Stochastics posted sell signals. Also on each previous occasion the market then retreated back towards the $16.16 floor in the subsequent week. This suggests that the market is drawn to this level like a moth to a flame and there is considerable risk of doing so once more. The hourly chart shows a band of initial resistance $16.60/$16.80 with the old pivot at $16.86 as the market will now be selling into strength.
EUR/USD
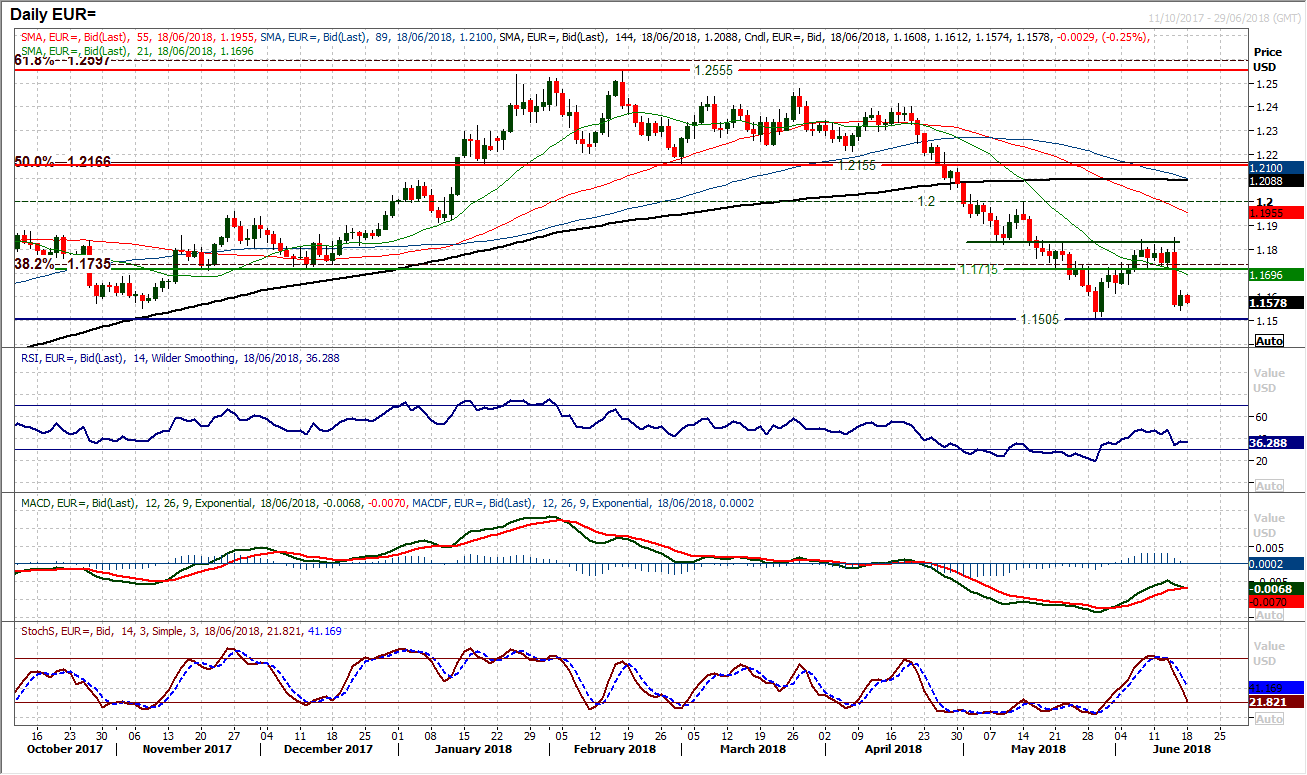
After such a strong bear candle on Thursday, the reaction on Friday would be key. If the market had continued lower it would have been a sign that there would likely have been a decisive shift in sentiment that could easily have been ongoing. However the bulls reacted by bouncing 40 pips with a solid positive candle on the session. This now needs to be followed additional positive candles too. The early reaction today has not been great though, with the market pulling back below the resistance band $1.1615/$1.1640. Momentum indicators are clearly still impacted by Thursday’s huge sell-off and still look to be progressing negatively. The initial support now from Friday’s low at $1.1540 is a key gauge for sentiment. If this is breached then it would suggest the sellers are once more gaining momentum for a test of the key May low at $1.1505. The bulls need to pull above $1.1640 which is a resistance on the hourly chart, in order to gain serious momentum in a recovery. For now the market is still finding its feet again, but the bulls have a battle on their hands.
GBP/USD
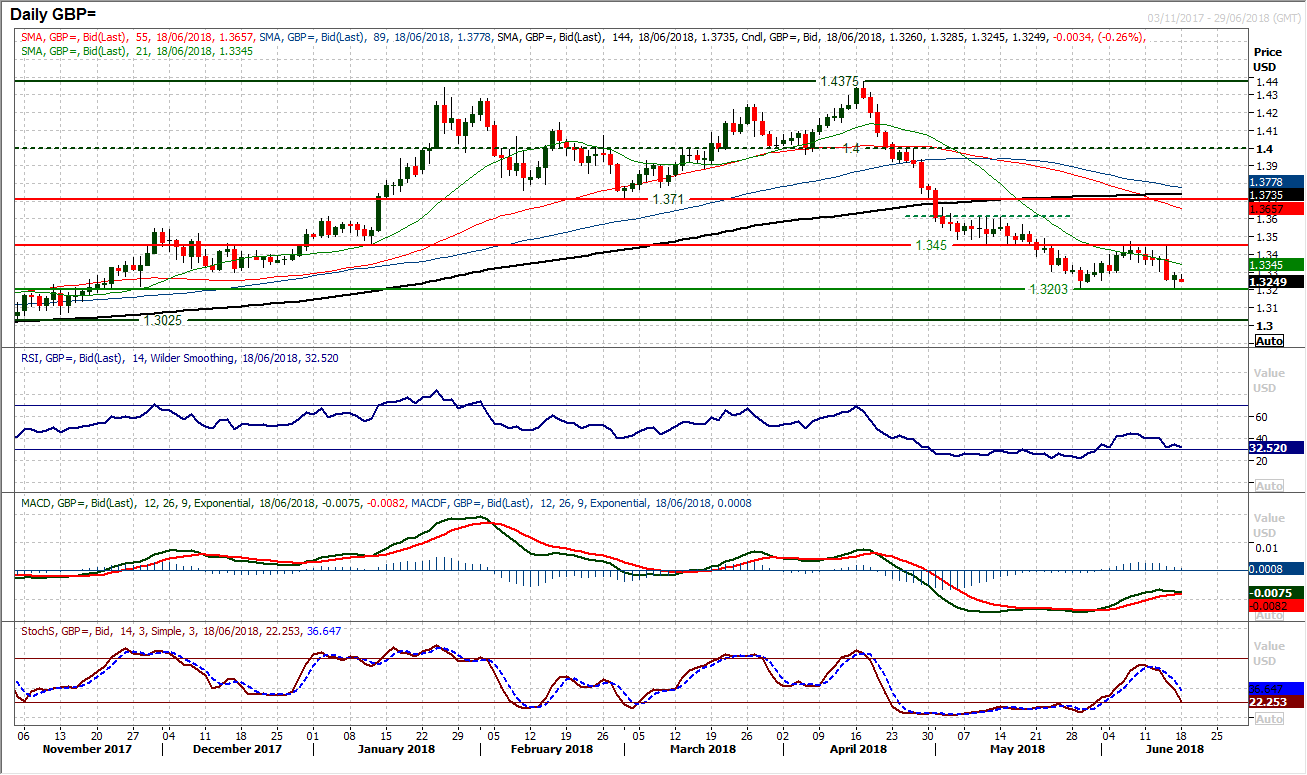
After the sharp move lower from Thursday, the market has tested the key May low t $1.3205, but the support has remained intact after an intraday rebound on Friday. This move formed a positive candle (almost a bull hammer) and it will be interesting to see if the bulls can muster a positive follow up session today in order to begin to rebuild again. Daily momentum indicators are tracking lower in the wake of Thursday still, whilst the hourly chart shows a band of resistance around $1.3300 and that the momentum needs to consistently build for the bulls to prevent this from being just a technical rally that is sold into again. There is further resistance at an old pivot at $1.3345. A break below $1.3205 would open $1.3025.
USD/JPY
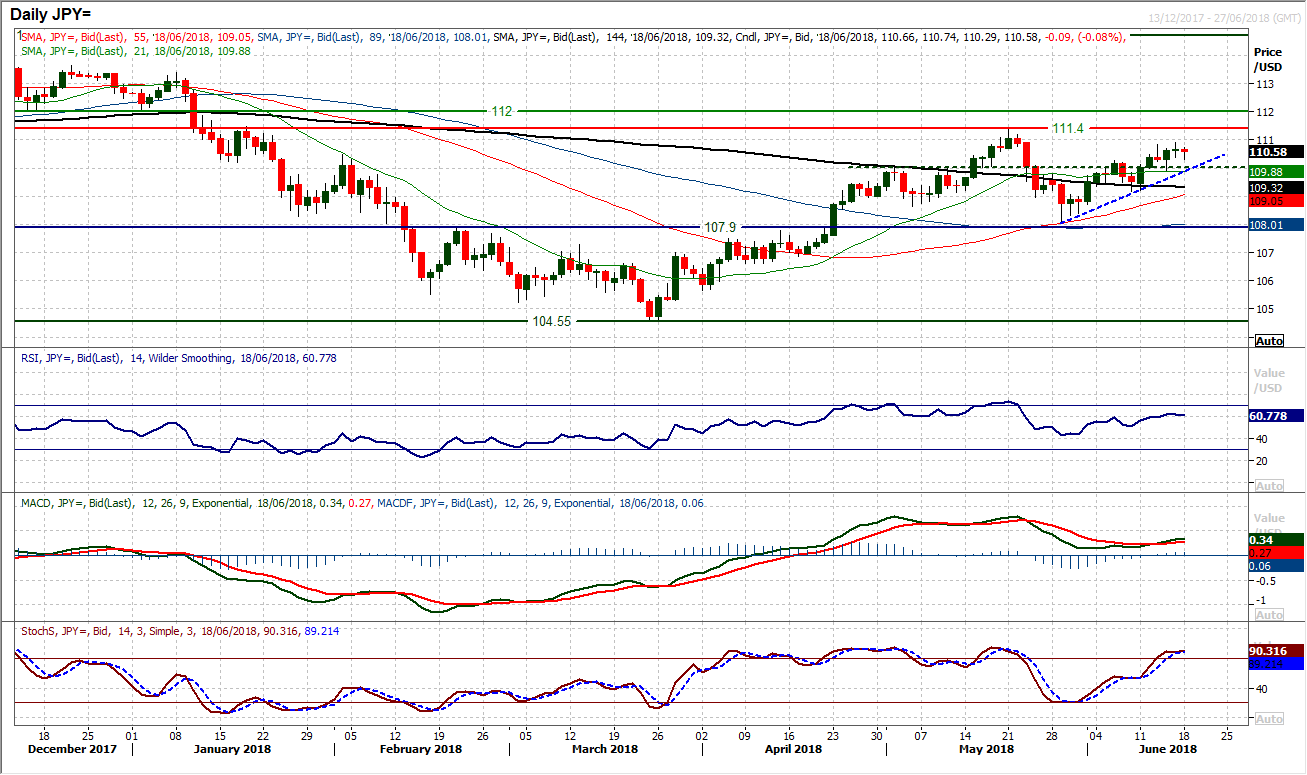
The move higher from the pivot around 110.00 that was seen last week continues to build the mini trend higher that is now approaching three weeks in duration. This trend is supportive today around 109.90 which is also last week’s low. A neutral looking indeterminate candle on Friday’s session has been followed by an early drop back today. However the run of higher lows and trend of improvement on the momentum would suggest that this early weakness will be seen as a chance to buy today. Friday’s high of 110.90 is now initial resistance that is protecting the key May high of 111.40 but the hourly chart shows momentum having unwound and a band of support 109.90/110.25 to build the next higher low. There is still a positive bias to the market moves, but the lack of conviction in the outlook suggests that 111.40 remains a key ceiling.
Gold
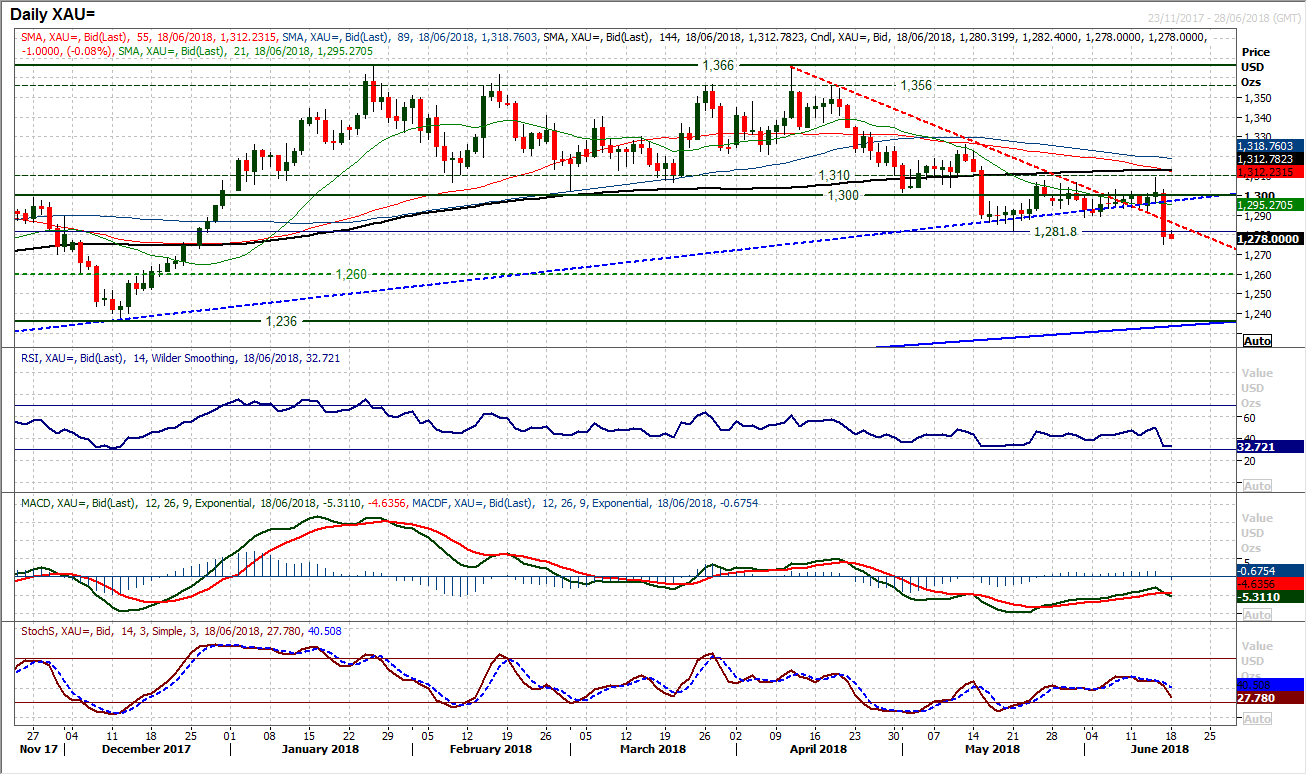
The long term pivot band $1300/$1310 has once more played a vital role in the outlook on gold. With the market failing to breakout above $1310 on Thursday, sharp selling pressure pulled the market decisively lower to form a huge one day bearish candlestick pattern, in a move that also closed below $1281.80 for the lowest level since late December. The medium term configuration on gold remains negative following the big multi-month top pattern below $1300 that implies $1236. This latest downside break adds to the likelihood of this move being seen. The market has spent the last month ranging between $1282/$1310 and a closing breach of this implies $28 of downside now in the coming month towards $1254. Momentum indicators have slipped lower again, suggesting that rallies remain a chance to sell. This means that a resistance band $1282/$1290 will now be a key gauge. Any near term rally that fails around here will be just another chance to sell. The resistance at $1300/$1310 gains in prominence too.
WTI Oil
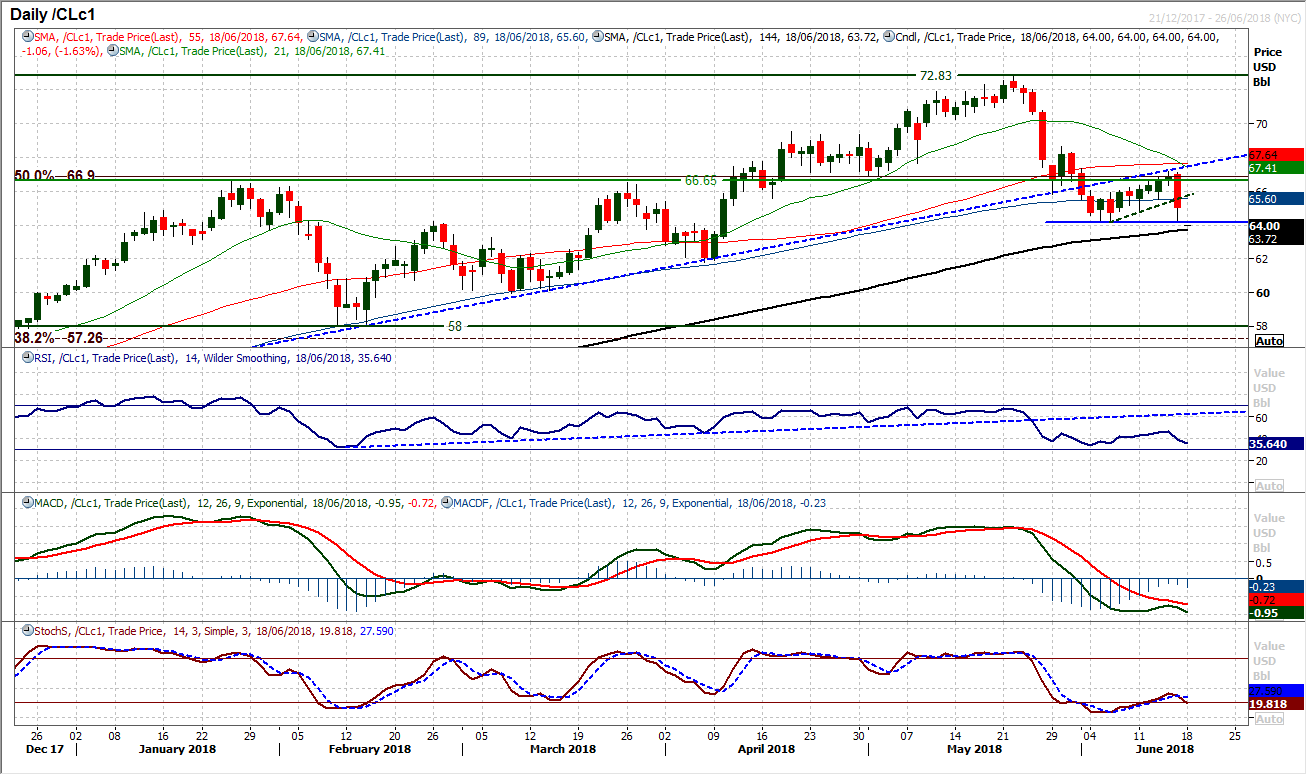
A sharp bear candle and downside break on Friday has broken a run of higher lows and now threatens to have formed another key lower high. Leaving resistance at $67.15 would now become a lower high if the support at $64.25 is broken. The concern is that this peak came around the 50% Fib level (at $66.90) and also under the resistance of the old nine month uptrend. These are negative medium term signals which would be confirmed should the market begin to break down below $64.25 in the coming days. Today’s reaction to the move is key and the early outlook does not look positive with the weakness continuing. A closing breach of $64.25 would initially imply $2.80 of additional downside. The market would also be forming a decisive new downtrend on a medium term basis. Next support is $62.05 the April low.
Dow Jones Industrial Average
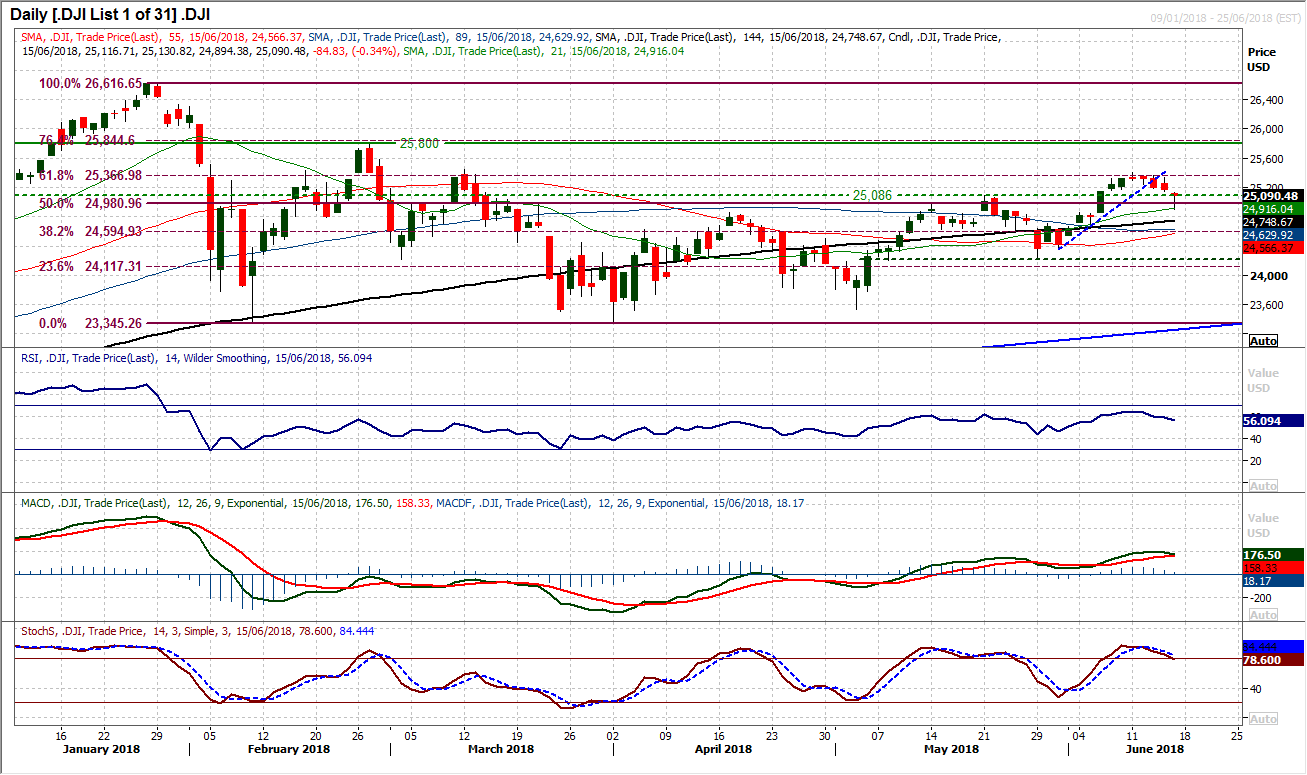
A corrective move seems to be building but the reaction to Friday’s intraday bounce into the close will be key. In the past few sessions as the corrective candles have been building, the prospect that this is not just an unwinding move to the medium term breakout support around 25,000 has been growing. Momentum indicators are now beginning to deteriorate, with the MACD line ready to cross back down again and the Stochastics on the brink of a near term confirmed sell signal. Although there was a bounce off 24,894 on Friday and a close below the 50% Fib level at 24,980 was prevented, unless the bulls can continue the intraday rally today then there is risk of further correction. There would also be a pivot band of resistance overhead between 25,086/25,175 to contend with today. A failure around here would increase the downside pressure.
Author

Richard Perry
Independent Analyst


