Rewiring global trade: Tariffs rewrite the map

Tariffs have gone from headline noise to full‑blown shock therapy: this year’s levy stack is already fatter than the entire 2018 volley, and retailers are bracing for a brutal 20‑30 % cliff in inbound containers. Think double‑digit hits to trans‑Pacific volumes just as back‐to‐school orders would normally be locking in space. My read: cue an inventory flush through summer, a freight‑rate lull, and a squeeze on working capital for every big‑box name that mis‑times the restock. The playbook mirrors 2018—rush orders, reroutes through Vietnam and Mexico, and a scramble for “substantial transformation” loopholes—but the numbers are supersized.
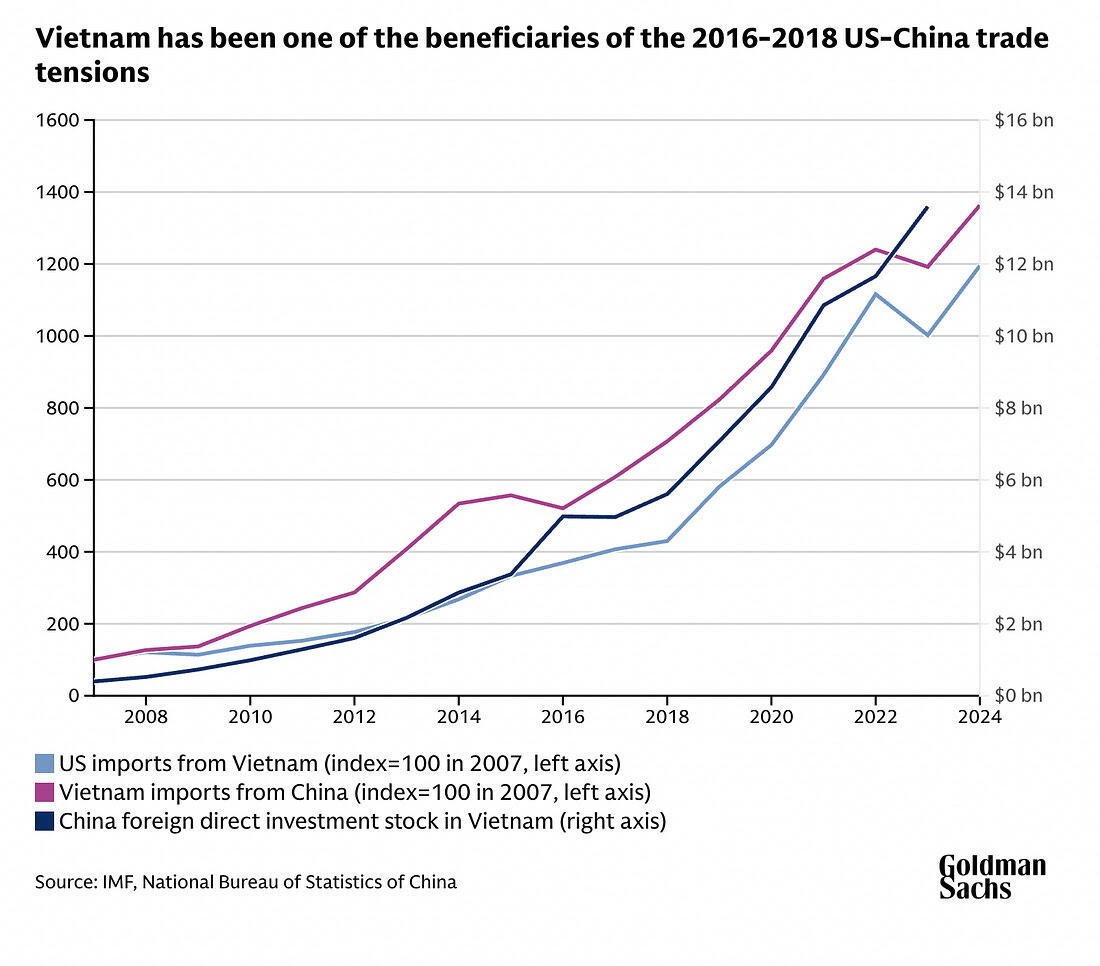
We’re about to plunge into the mother of all inventory flushes. Q1’s “beat‑the‑tariff” buying spree kept the seaborne numbers plump, but the cupboards are now too full—and the clearing‑out phase will run straight through Q3, maybe Q4. Watch the data: container bookings and warehouse vacancy rates will sag first, followed by ugly comps for the big box retailers that thought they were geniuses front‑loading at pre‑levy prices. Yet once shelves start to echo and SKU managers smell lost sales, the restock scramble will flip the switch. Importers will swallow the sticker shock, reroute around Mexico or Vietnam where they can, but ultimately march right back to Chinese supply because scale still beats sentiment.
Yes, these tariffs dwarf anything we saw in 2018—think Smoot‑Hawley on steroids—so the coming trade contraction could rival the GFC drop. But don’t confuse depth with permanence. Round‑robin routes will flourish (label says “Made in Ho Chi Minh,” BOM still screams “Shenzhen”), and Asia’s position as the trade vortex won’t budge; every fast‑growing lane still arcs out of the region, especially into the Global South.
Tariffs can shuffle the deck, but they don’t change where the table sits. China still owns the lion’s share of the world’s factory floor, with a labor army that dwarfs the combined workforces of the USMCA bloc five‑to‑one. Even the most zealous reshoring cheerleaders can only trim that reliance at the edges; the math just doesn’t budge.
-638819924645588479.jpg)
Right now, over a third of all U.S. imports from China come from product lines where Beijing supplies 70 %‑plus of total U.S. demand. Swap in Mexico, sprinkle some Vietnam, build a few shiny stateside fabs—fine. The core truth remains: for everything from routers to running shoes the U.S. supply chain’s umbilical cord still plugs into the Pearl River Delta. Until someone invents instant manufacturing scale on American soil, tariffs are a cost pass‑through, not a pivot point. Plan trades—and policy bets—accordingly.
If you want a real‑time read on the tariff pain, forget the headline chatter and watch the three dials that actually move freight desks:
1. ISM New‑Orders vs. Inventories. When the de‑stocking drag finishes its purge, New Orders will bottom, inventories will print their low, and the ratio will start climbing. That turn—often weeks before the GDP crowd notices—screams “restock incoming” and precedes a jump in inbound TEUs every single cycle. A sustained uptick here is the market’s early siren that U.S. buyers just flipped from liquidation to fill‑the‑shelves at any cost.
2. China port throughput. Shanghai, Ningbo, Yantian: acreage of boxes leaving those gates is broadcast almost in real‑time. A rebound in export lifts will front‑run U.S. customs data by a month. Overlay that with spot freight rates; when volumes pop and rates stop bleeding, you’ve got confirmation that tariff shock is being absorbed—at higher landed costs, sure, but absorbed nonetheless.
3. Trans‑Pacific booking indices. Platforms like Freightos and Xeneta publish live booking momentum. Watch for a pivot from week‑on‑week declines to flat, then +5 % prints—that usually aligns with the ISM turn but shows up even earlier.
Scenario planning is straightforward:
-
Tariff climb‑down: volumes snap back within two quarters, just like post‑2019. Freight equities rip, trucking capacity tightens, and retailers’ margin guides stabilize.
-
Tit‑for‑tat escalation: expect port data to stay soft, rates to trickle lower, and working‑capital stress to spread—plus a fresh round of retaliation risk on ag and aerospace.
Either way, those three gauges tell you before the nightly news does. Keep them on the dashboard; fade the narrative, trade the tape.
Author

Stephen Innes
SPI Asset Management
With more than 25 years of experience, Stephen has a deep-seated knowledge of G10 and Asian currency markets as well as precious metal and oil markets.


