Good Morning Traders,

As of this writing 5 AM EST, here’s what we see:

US Dollar: Dec. USD is Up at 98.035.
Energies:
November Crude is Down at 50.66.
Financials: The Dec 30 year bond is Down 16 ticks and trading at 162.26.
Indices: The December S&P 500 emini ES contract is 24 ticks lower and trading at 2121.00.
Gold: The December gold contract is trading Down at 1253.30. Gold is 22 ticks lower than its close.

Initial Conclusion

This is not a correlated market. The dollar is Up+ and crude is Down - which is normal but the 30 year bond is trading Down. The Financials should always correlate with the US dollar such that if the dollar is lower then bonds should follow and vice-versa. The indices are Down and Crude is trading Down which is not correlated. Gold is trading Down which is correlated with the US dollar trading Up. I tend to believe that Gold has an inverse relationship with the US Dollar as when the US Dollar is down, Gold tends to rise in value and vice-versa. Think of it as a seesaw, when one is up the other should be down. I point this out to you to make you aware that when we don’t have a correlated market, it means something is wrong. As traders you need to be aware of this and proceed with your eyes wide open.

All of Asia traded lower with the exception of the Japanese Nikkei exchange which traded higher.  As of this writing all of Europe is trading lower.

Possible Challenges To Traders Today

–  Empire State Mfg Index is out at 8:30 AM.  This is major.

–  Capacity Utilization Rate is out at 9:15 AM EST.  This is major.

–  Industrial Production m/m is out at 9:15 AM EST.  This is major.

–  FOMC Member Fischer Speaks at 12:15 PM.  This is major.

Treasuries

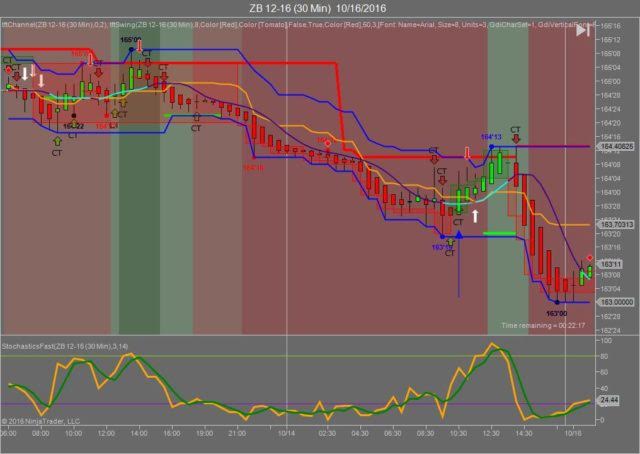
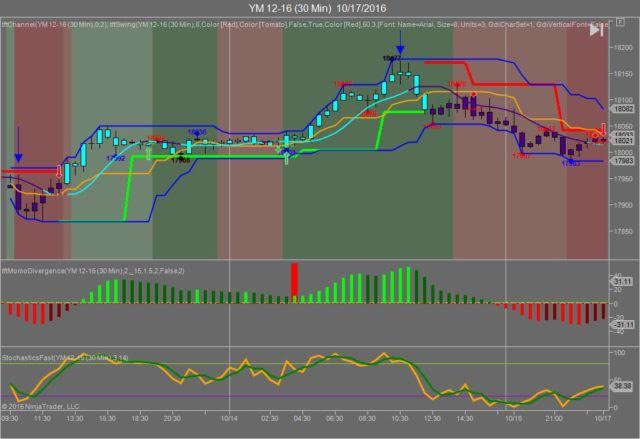
We’ve elected to switch gears a bit and show correlation between the 30 year bond (ZB) and The YM futures contract. The YM contract is the DJIA and the purpose is to show reverse correlation between the two instruments.  Remember it’s liken to a seesaw, when up goes up the other should go down and vice versa.

Yesterday the ZB made it’s move at around 10:30 AM EST when most of the economic news was reported. The ZB hit a low at around that time and the YM hit a high.  If you look at the charts below ZB gave a signal at around 10:30 AM EST and the YM was moving lower at the same time. Look at the charts below and you’ll see a pattern for both assets. ZB hit a low at around 10:30 AM EST and the YM hit a high.  These charts represent the latest version of Trend Following Trades and I’ve changed the timeframe to a 30 minute chart to display better.  This represented a long opportunity on the 30 year bond, as a trader you could have netted about 20 plus ticks per contract on this trade. Each tick is worth $31.25. We added a Donchian Channel to the charts to show the signals more clearly.

Charts Courtesy of Trend Following Trades built on a NinjaTrader platform

ZB

YM

Bias

On Friday we gave the markets a neutral bias as we had 10 economic reports, most of which were major.  The Dow gained 39 points and the other indices gained fractionally.  Today we aren’t with a correlated market and our bias is neutral.

Could this change? Of Course.  Remember anything can happen in a volatile market. 

Commentary

Friday morning the indices were up but only fractionally meaning they had no conviction and as such our bias was neutral. The economic news came out and it seemed that Retail Sales picked up a bit as it went from a minus two tenths of 1 percent to a positive 5 tenths of 1 percent.  This was evidently enough for the markets as they took off and went over 100 points from Thursday’s close.  Today we have Empire State Manufacturing Index which is major and a proven market mover.

Trading performance displayed herein is hypothetical. The following Commodity Futures Trading Commission (CFTC) disclaimer should be noted.

Hypothetical performance results have many inherent limitations, some of which are described below. No representation is being made that any account will or is likely to achieve profits or losses similar to those shown.

In fact, there are frequently sharp differences between hypothetical performance results and the actual results subsequently achieved by any particular trading program. One of the limitations of hypothetical performance trading results is that they are generally prepared with the benefit of hindsight.

In addition, hypothetical trading does not involve financial risk, and no hypothetical trading record can completely account for the impact of financial risk in actual trading. For example, the ability to withstand losses or to adhere to a particular trading program in spite of trading losses are material points which can also adversely affect actual trading results.

There are numerous other factors related to the markets in general or to the implementation of any specific trading program which cannot be fully accounted for in the preparation of hypothetical performance results and all of which can adversely affect actual trading results.

Trading in the commodities markets involves substantial risk and YOU CAN LOSE A LOT OF MONEY, and thus is not appropriate for everyone. You should carefully consider your financial condition before trading in these markets, and only risk capital should be used.

In addition, these markets are often liquid, making it difficult to execute orders at desired prices. Also, during periods of extreme volatility, trading in these markets may be halted due to so-called “circuit breakers” put in place by the CME to alleviate such volatility. In the event of a trading halt, it may be difficult or impossible to exit a losing position.

Recommended Content


Recommended Content

Editors’ Picks

EUR/USD steadies above 1.0600, awaits German ZEW and Powell speech

EUR/USD steadies above 1.0600, awaits German ZEW and Powell speech

EUR/USD is holding above 1.0600 in the European morning on Tuesday, having hit fresh five-month lows. The pair draws support from sluggish US Treasury bond yields but the rebound appears capped amid a stronger US Dollar and risk-aversion. Germany's ZEW survey and Powell awaited. 

EUR/USD News

GBP/USD stays below 1.2450 after UK employment data

GBP/USD stays below 1.2450 after UK employment data

GBP/USD trades marginally lower on the day below 1.2450 in the early European session on Tuesday. The data from the UK showed that the ILO Unemployment Rate in February rose to 4.2% from 4%, weighing on Pound Sterling.

GBP/USD News

Will Gold reclaim $2,400 ahead of Powell speech?

Will Gold reclaim $2,400 ahead of Powell speech?

Gold price consolidates the rebound below $2,400 amid risk-aversion. Dollar gains on strong US Retail Sales data despite easing Middle East tensions. Bullish potential for Gold price still intact on favorable four-hour technical setup.

Gold News

SOL primed for a breakout as it completes a rounding bottom pattern

SOL primed for a breakout as it completes a rounding bottom pattern

Solana price has conformed to the broader market crash, following in the steps of Bitcoin price that remains in the red below the $65,000 threshold. For SOL, however, the sensational altcoin could have a big move in store.

Read more

Key economic and earnings releases to watch

Key economic and earnings releases to watch

The market’s focus may be on geopolitical issues at the start of this week, but there is a large amount of economic data and more earnings releases to digest in the coming days. 

Read more

Majors

Cryptocurrencies

Signatures