10/22 Recap: - The S&P opened with an 4 handle gap down and continued 4 handles lower into a 9:30 AM low.  From that low, the S&P zig zagged 18 handles higher into a 10:30 AM high of the day and a new all-time high.  From that high, the S&P declined 36 handles into an 11:49 AM low.  From that low, the S&P rallied 30 handles into a 2:37 PM high.  From that high, the S&P declined 13 handles into a 3:19 PM low.  From that low, the S&P rallied about 4 handles into the close.      


10//22 – The major indices had a very divergent day with the following closes: The DJIA + 73.94; S&P 500 - 4.88; and the

Nasdaq Composite – 125.50.  The DJIA made a new all-time high at 35.765.02; The S&P 500 made a new all-time high at 4559.67.

Looking ahead  – Friday, the market had a very mixed divergent day with the S&P having a small lower close. Unfortunately, this gives us very little if any clue as to what we should do with our 10/22 AC change in trend window.  There is a good chance that for a few days next week, the market will follow a mirror image of the past few days, which means choppy, whippy and mostly sideways.   It could be more super siesta sideways action.   Whatever trend is established by Tuesday is likely to continue for the rest of the week, as there are no major change in trend points for the rest of the week.

The NOW Index is in the NEUTRAL ZONE. 

Coming Events:   

(Stocks potentially respond to all events).    

4.  A. 10/22 AC – Mercury Greatest Elongation West.  Major change in trend Corn, Oats, Soybeans, Wheat. 

     B. 10/22 AC – Jupiter 150 US Neptune.  Moderate change in trend US Stocks, T-Bonds, US Dollar, & Oil.

     C. 10/22 AC – Uranus 90 US MC.  Major change in trend US Stocks, T-Bonds, US Dollar.

5. A. 10/29 AC – Venus Greatest Elongation East.  Major change in trend Cattle, Copper, Cotton, Sugar, Wheat.5

    B. 10/29 AC –  Pluto 90 US Mercury.  Major change in trend US Stocks, T-Bonds, US Dollar.

    C. 10/29 AC – Geo Mars enters Scorpio.  Important change in trend Cocoa, Hogs, and T-Bonds.


Stock Market Key Dates –

Fibonacci – 10/29

Astro – 10/25, 10/29 AC

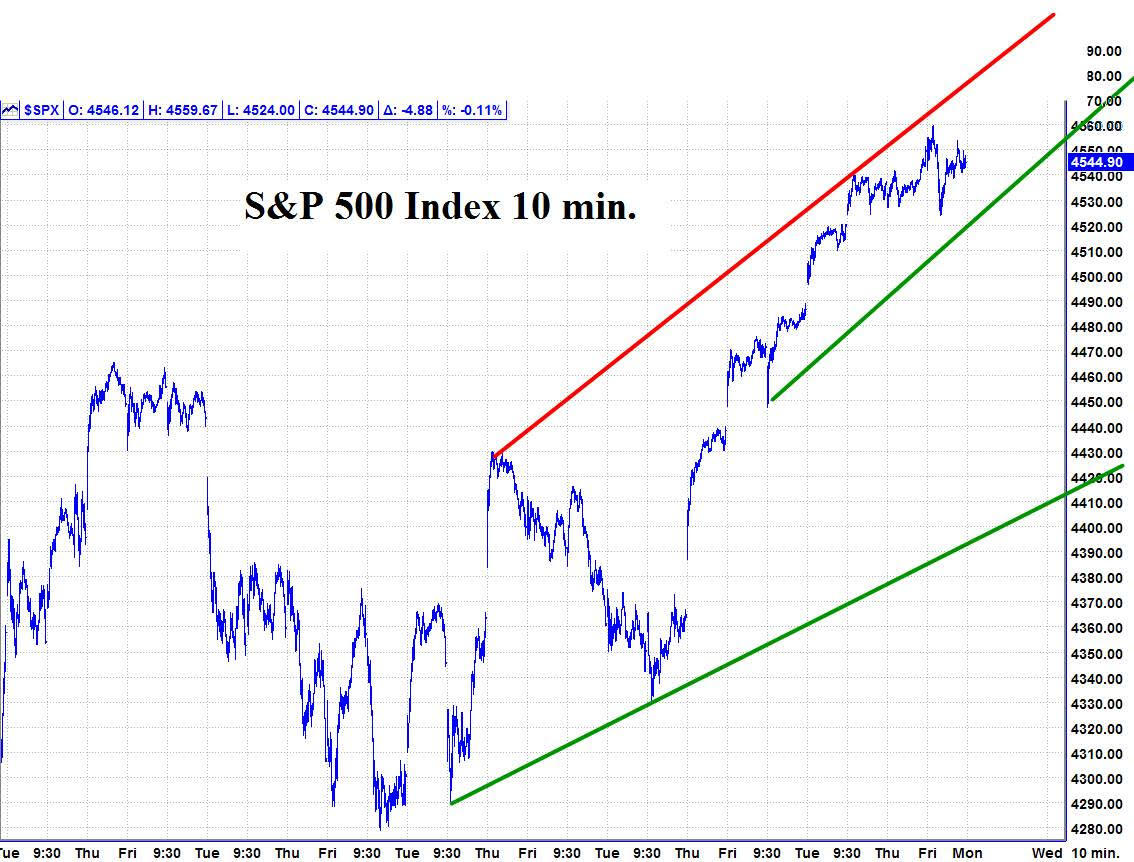
Please see below the S&P 500 10 minute chart.                     

Support  - 4524,  Resistance – 4580


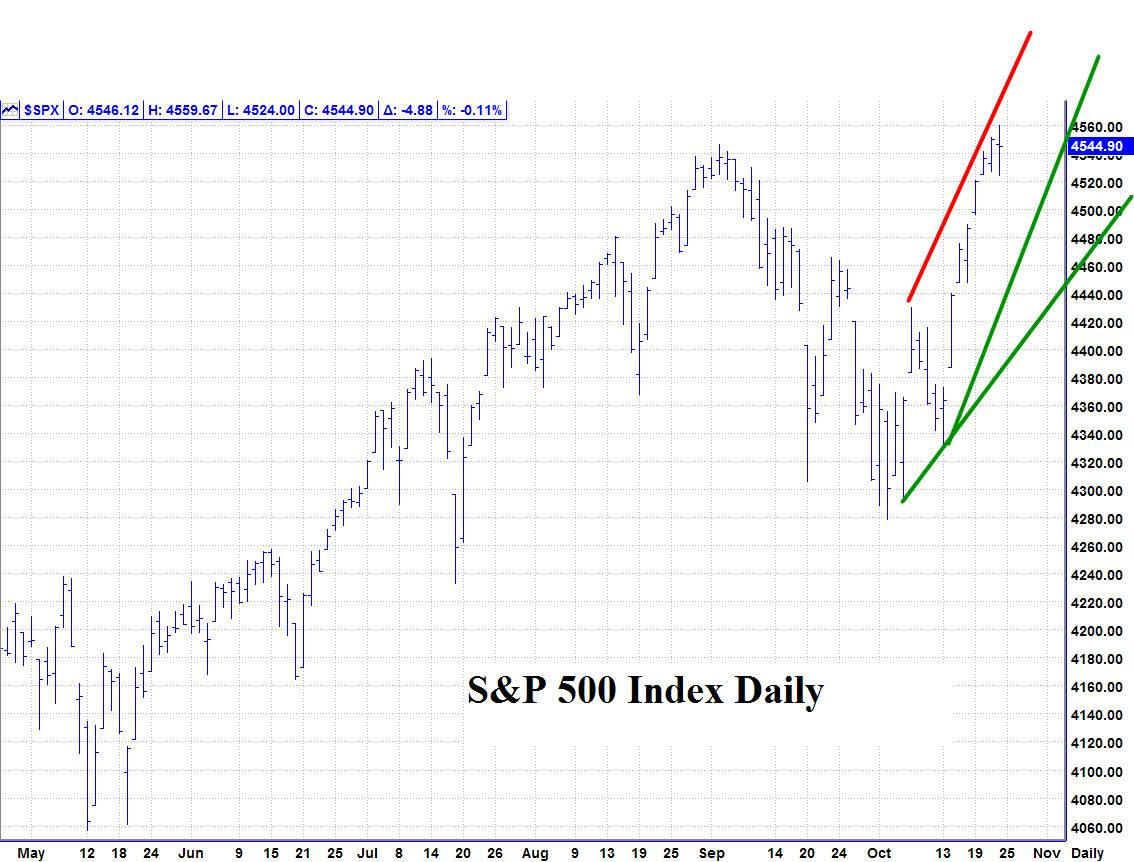
Please see below the S&P 500 Daily chart

Support  - 4540,  Resistance – 4580           

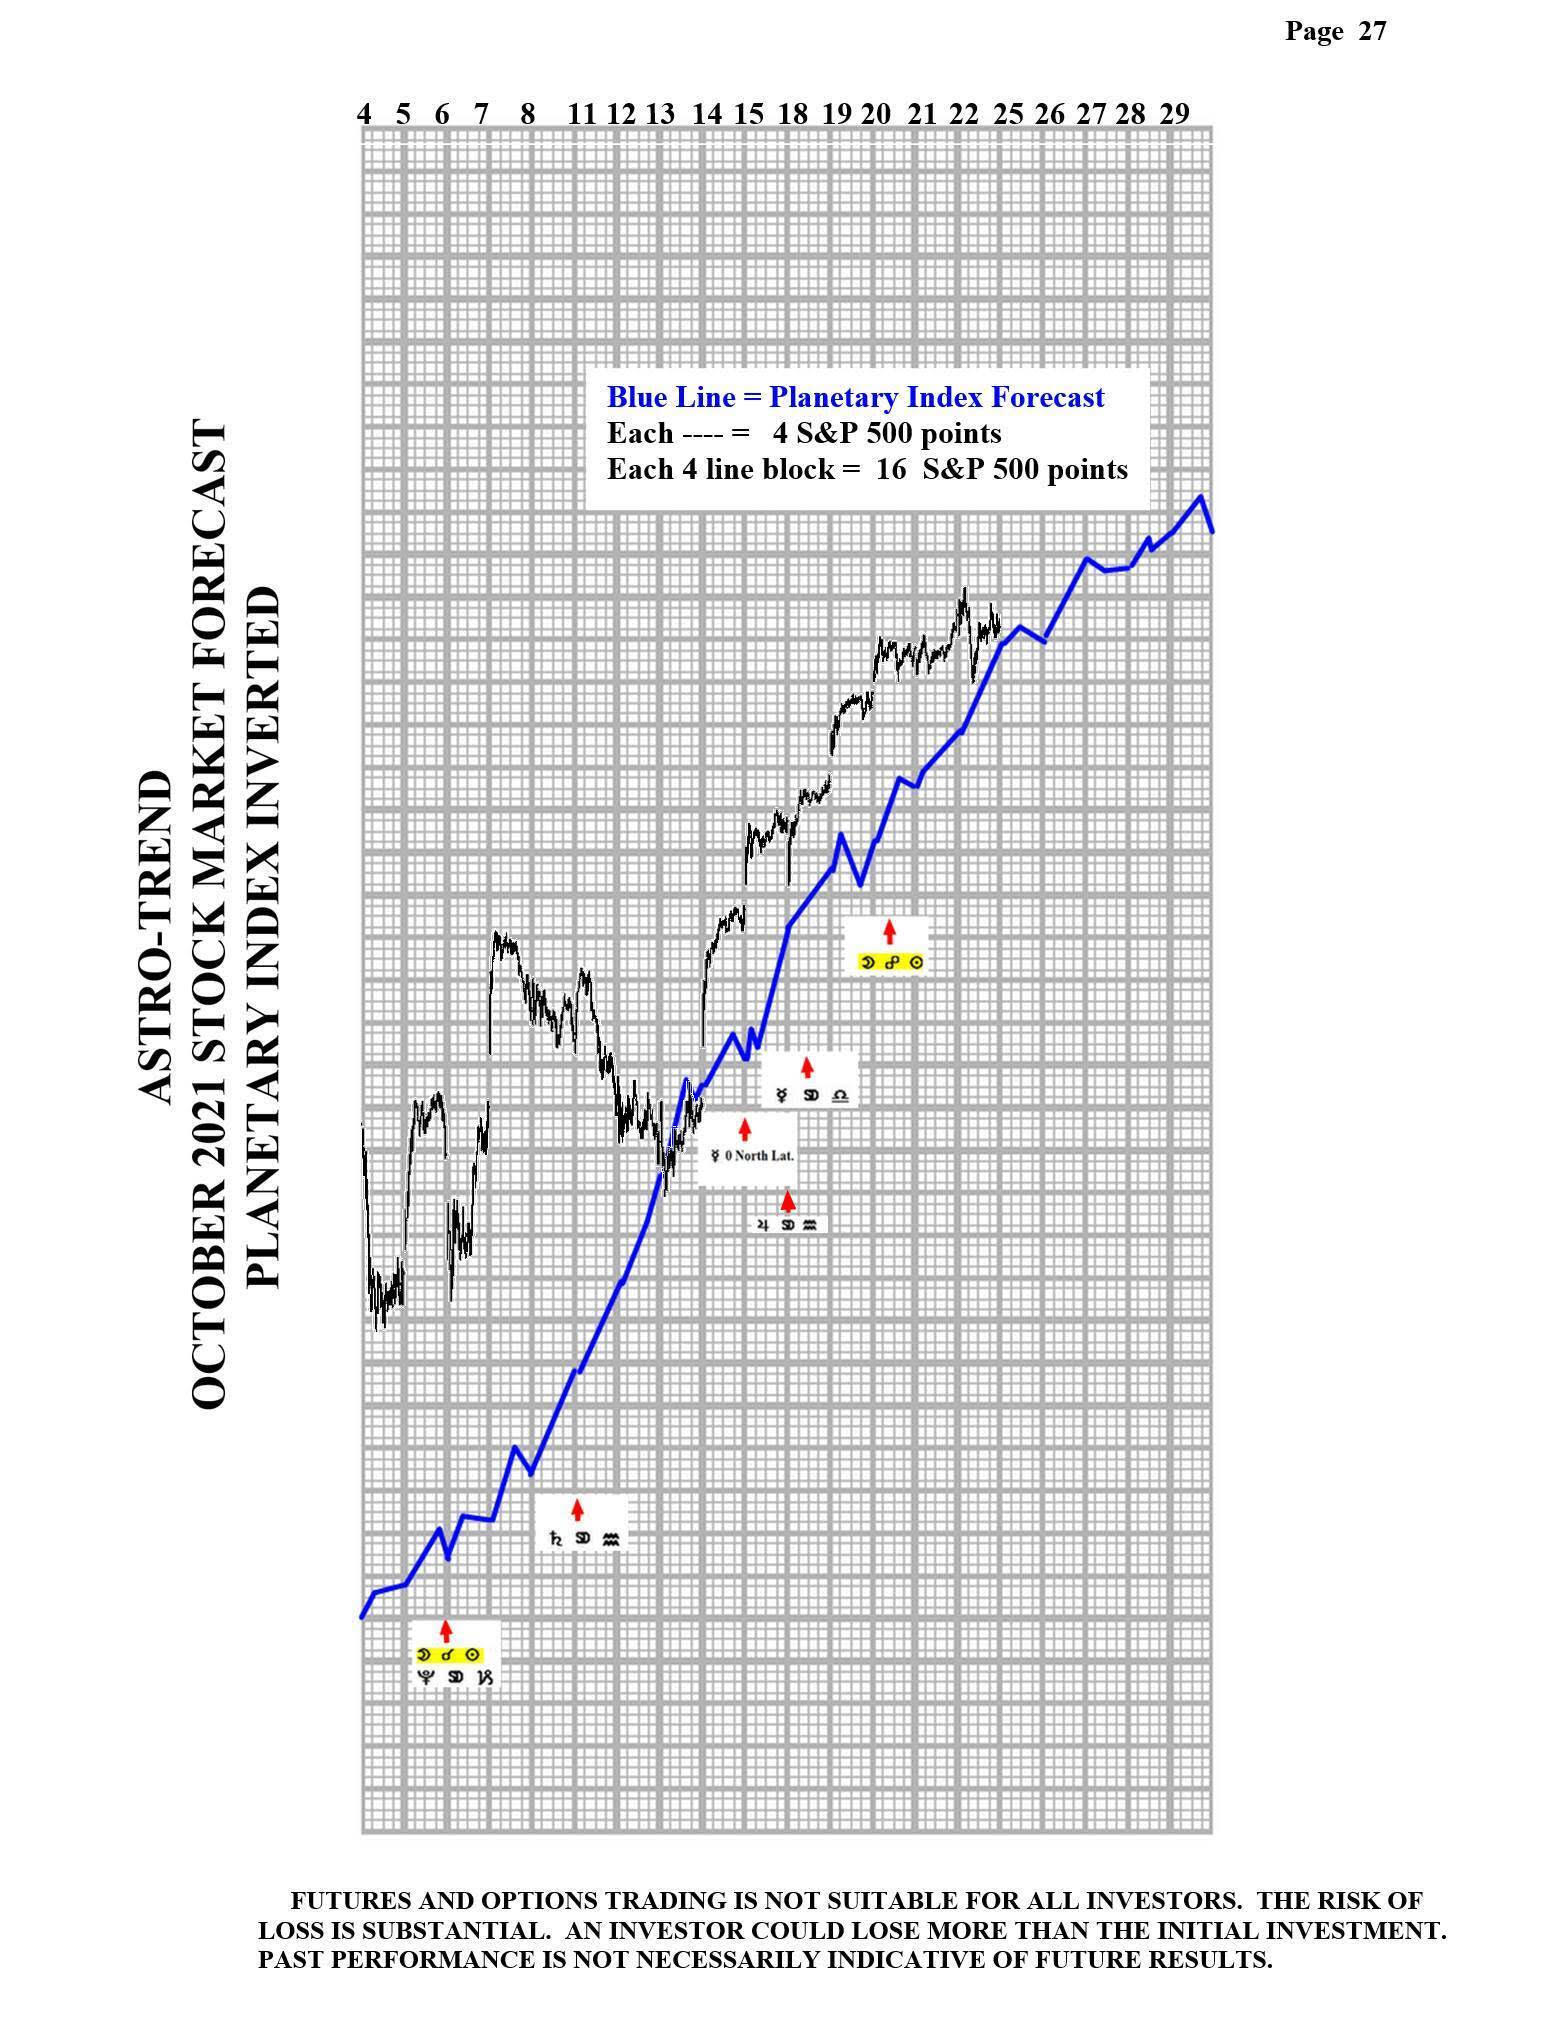
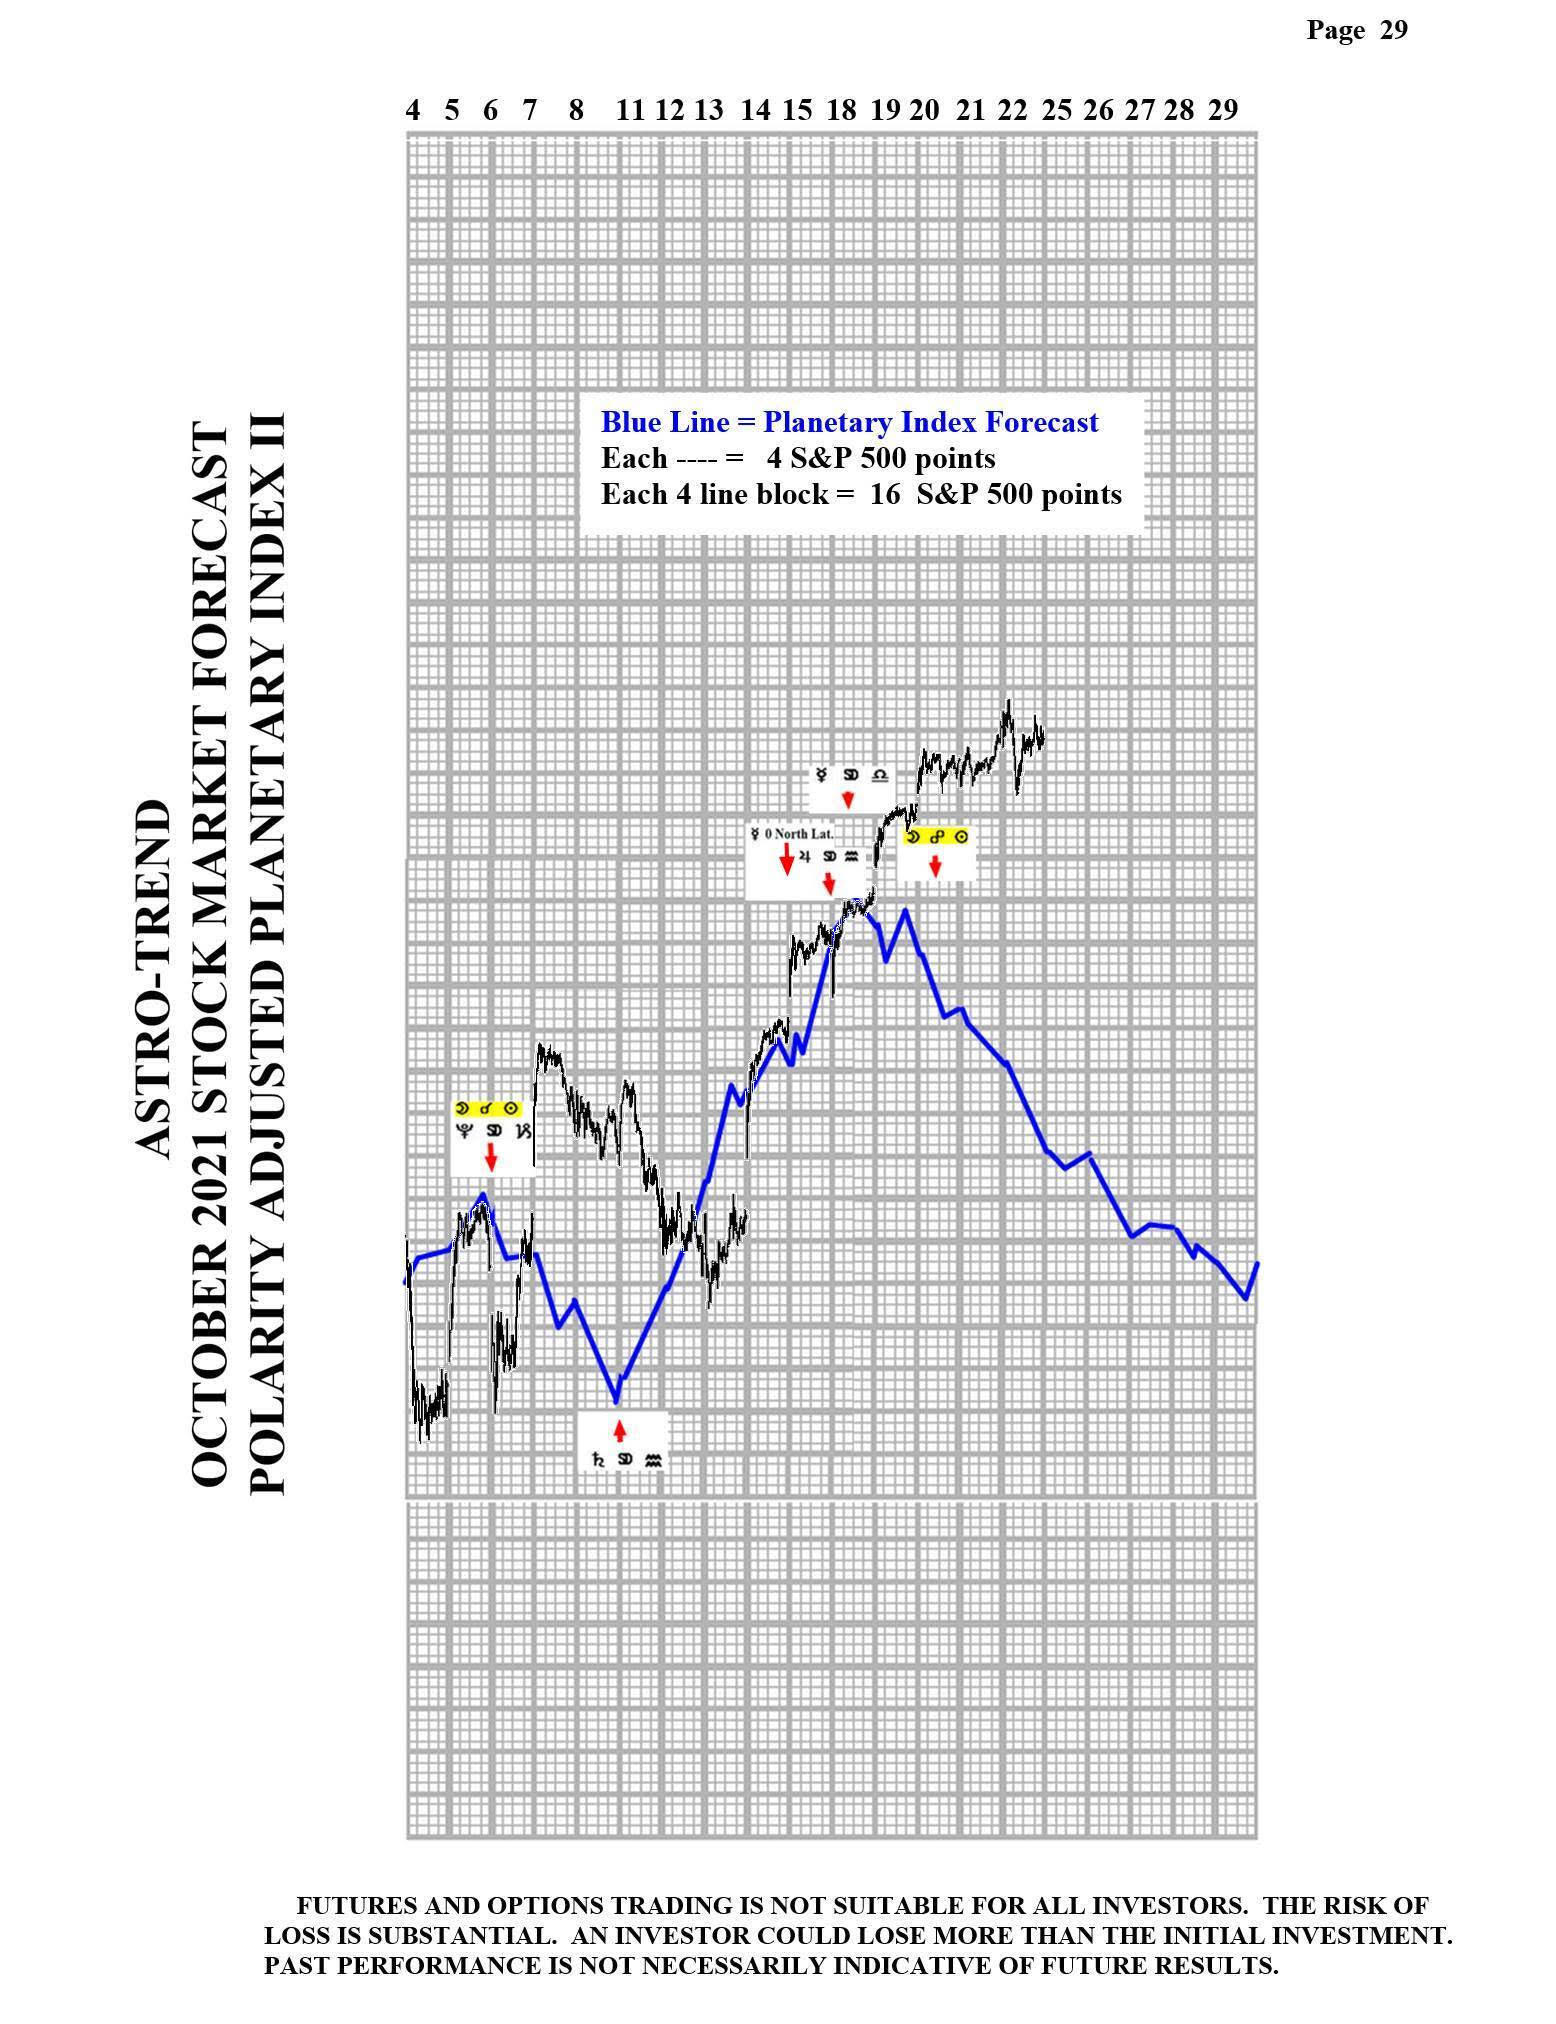
 Please see below the Planetary Index charts with S&P 500 10 minute bars for results.

As of 10/22, I am dropping the charts marked Pages 26 and 28. 


Note: All information on this page is subject to change. The use of this website constitutes acceptance of our user agreement. Please read our privacy policy and legal disclaimer. Opinions expressed at FXstreet.com are those of the individual authors and do not necessarily represent the opinion of FXstreet.com or its management. Risk Disclosure: Trading foreign exchange on margin carries a high level of risk, and may not be suitable for all investors. The high degree of leverage can work against you as well as for you. Before deciding to invest in foreign exchange you should carefully consider your investment objectives, level of experience, and risk appetite. The possibility exists that you could sustain a loss of some or all of your initial investment and therefore you should not invest money that you cannot afford to lose. You should be aware of all the risks associated with foreign exchange trading, and seek advice from an independent financial advisor if you have any doubts.

Recommended Content


Recommended Content

Editors’ Picks

EUR/USD climbs to 10-day highs above 1.0700

EUR/USD climbs to 10-day highs above 1.0700

EUR/USD gained traction and rose to its highest level in over a week above 1.0700 in the American session on Tuesday. The renewed US Dollar weakness following the disappointing PMI data helps the pair stretch higher.

EUR/USD News

GBP/USD extends recovery beyond 1.2400 on broad USD weakness

GBP/USD extends recovery beyond 1.2400 on broad USD weakness

GBP/USD gathered bullish momentum and extended its daily rebound toward 1.2450 in the second half of the day. The US Dollar came under heavy selling pressure after weaker-than-forecast PMI data and fueled the pair's rally. 

GBP/USD News

Gold struggles around $2,325 despite broad US Dollar’s weakness

Gold struggles around $2,325 despite broad US Dollar’s weakness

Gold reversed its direction and rose to the $2,320 area, erasing a large portion of its daily losses in the process. The benchmark 10-year US Treasury bond yield stays in the red below 4.6% following the weak US PMI data and supports XAU/USD.

Gold News

Here’s why Ondo price hit new ATH amid bearish market outlook Premium

Here’s why Ondo price hit new ATH amid bearish market outlook

Ondo price shows no signs of slowing down after setting up an all-time high (ATH) at $1.05 on March 31. This development is likely to be followed by a correction and ATH but not necessarily in that order.

Read more

Germany’s economic come back

Germany’s economic come back

Germany is the sick man of Europe no more. Thanks to its service sector, it now appears that it will exit recession, and the economic future could be bright. The PMI data for April surprised on the upside for Germany, led by the service sector.

Read more

Majors

Cryptocurrencies

Signatures