|

Results and update: Multiple successive change in trend windows

10/18 Recap: - The S&P opened with an 8 handle gap down and then dropped another 17 handles into a 9:35 AM low of the day.  From that low, the S&P rallied 36 handles into an 11:23 AM high.  Please note, this was the momentum high of the day and this occurred about 16 minutes past the 11:07 AM Mercury Direct.  From that high, the S&P traded into a very narrow 5 handle range, culminating with a low at 2:27 PM.  From that low, the S&P rallied 8 – 9 handles into the close. 

Chart

10//18 – Following a sizeable dip into the open, the major indices had a mixed to moderate up day with the following closes:

The DJIA - 36.15; S&P 500 + 15.09; and the Nasdaq Composite + 124.47.  

Looking ahead  – We are now in for about 2 more days of this tight series of multiple successive change in trend windows.  

Usually, we when have this kind of pattern, we get multiple whipsaws with up one day and down the next. We got a sample of this with the dip on Monday’s opening.  Please see the details below. 

The NOW Index is in the NEUTRAL ZONE. 

Coming events

(Stocks potentially respond to all events).   

3. A. 10/18 AM – Mercury in Libra turns Direct.  Major change in trend Corn, Oats, Soybeans, Sugar, and WHEAT. 

    B. 10/19 AM – Helio Saturn 90 Uranus.  Major change in trend Coffee and COPPER.

    C. 10/19 AC – Mercury Perihelion.  Major change in trend CORN, Gold, Oats, OJ, Soybeans, Wheat. 

    D. 10/20 AM - Full Moon in Aries. Major Change in Trend Financials, Grains, Precious Metals and especially Sugar and Wheat.

4.  A. 10/22 AC – Mercury Greatest Elongation West.  Major change in trend Corn, Oats, Soybeans, Wheat. 

     B. 10/22 AC – Jupiter 150 US Neptune.  Moderate change in trend US Stocks, T-Bonds, US Dollar, & Oil.

     C. 10/22 AC – Uranus 90 US MC.  Major change in trend US Stocks, T-Bonds, US Dollar.

Stock market key dates

Fibonacci – 10/18, 10/29.

Astro –10/18, 10/20, 10/25, 10/29 AC.

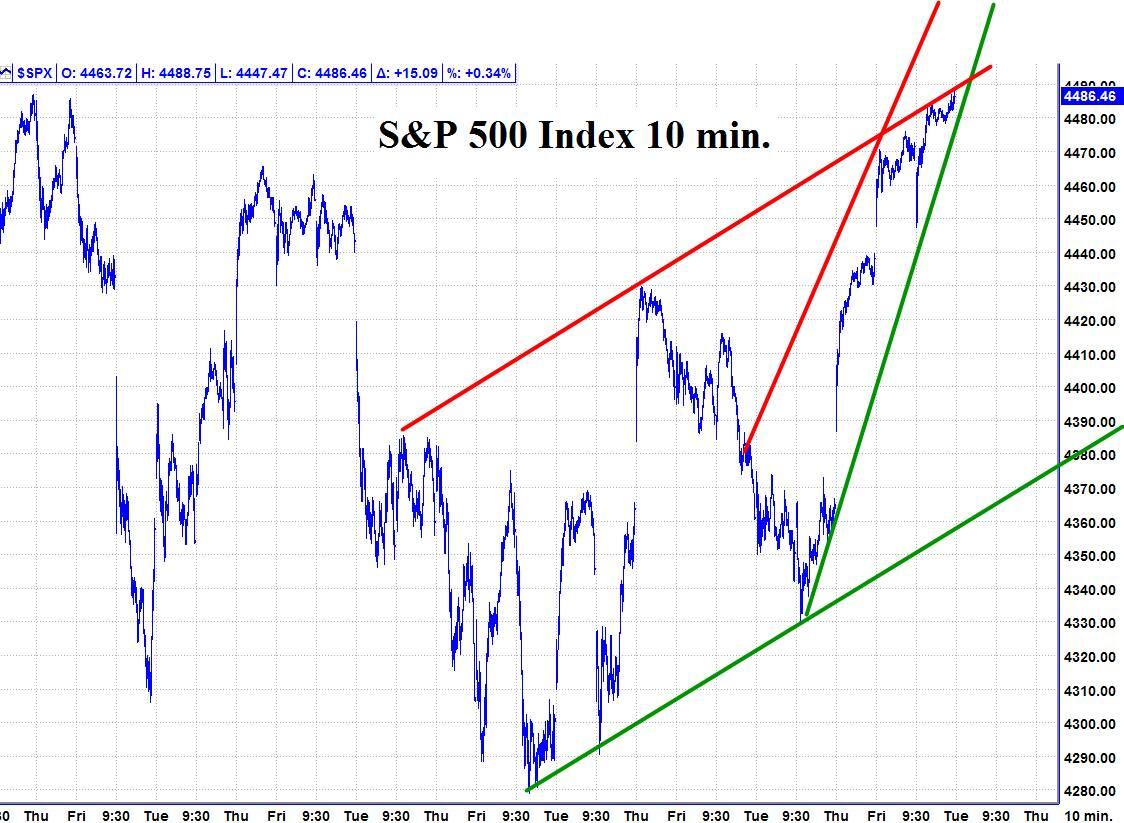
Please see below the S&P 500 10 minute chart.                     

Support  - 4470, 4360,  Resistance – 4490.

Chart

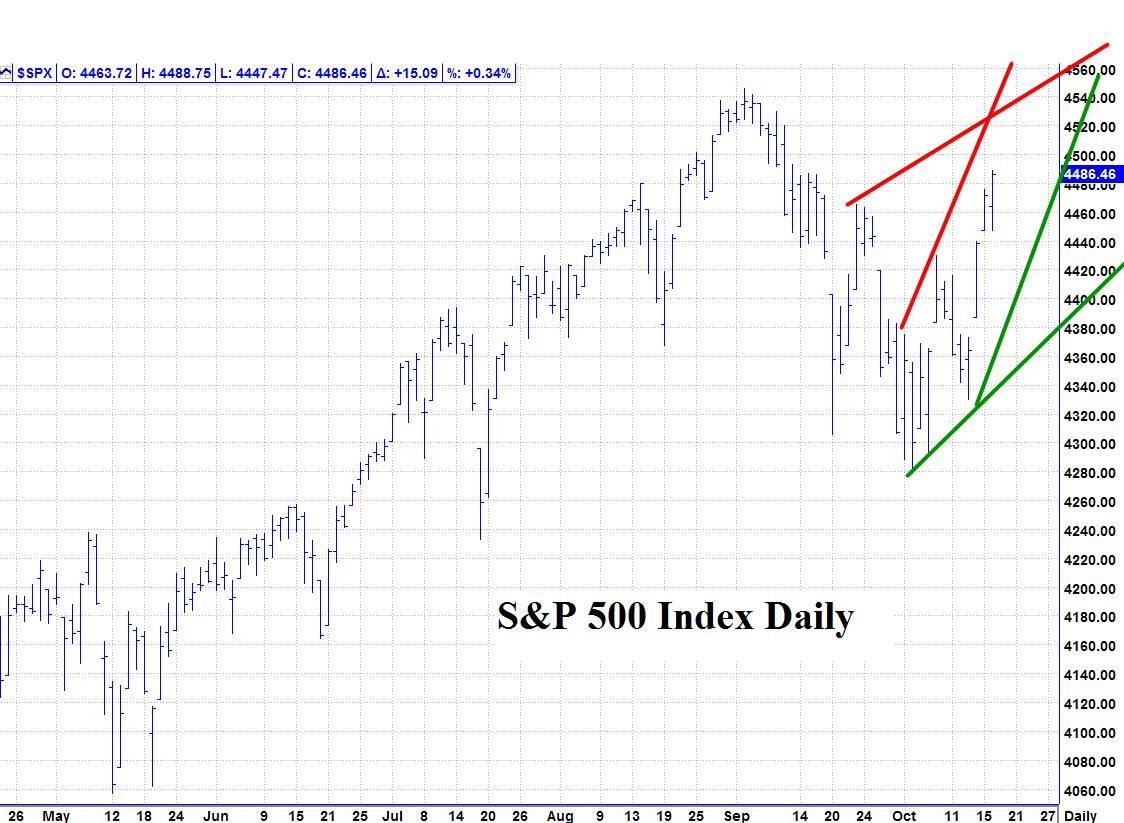
Please see below the S&P 500 Daily chart.                                            

Support  - 4470, 4360,  Resistance – 4490, 4530.

Chart

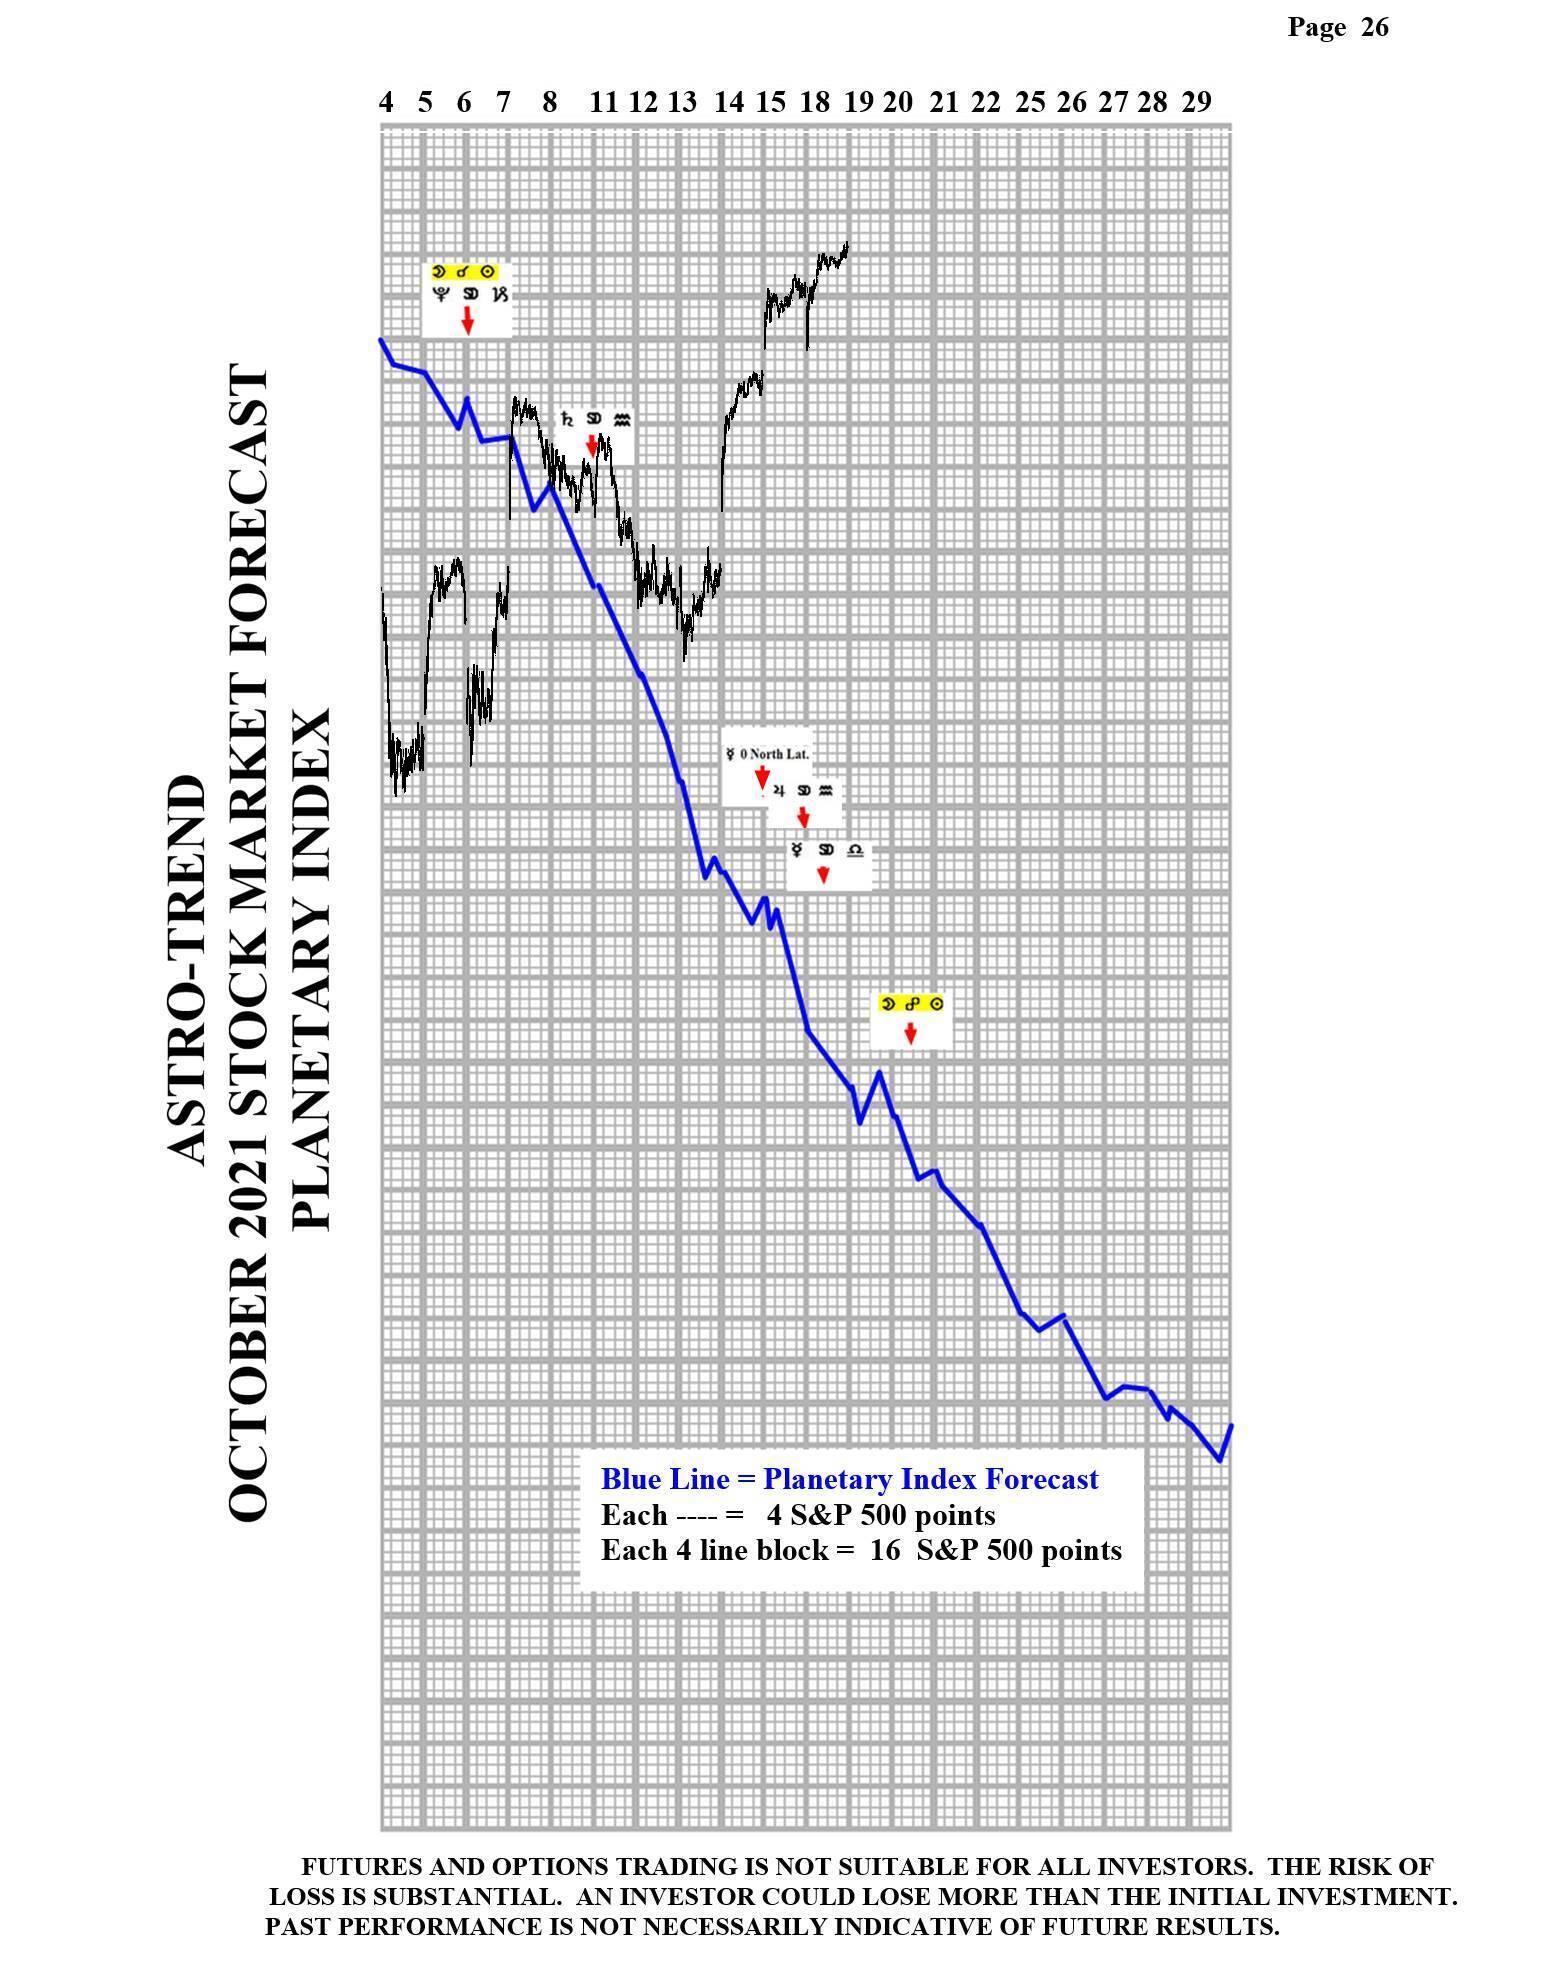
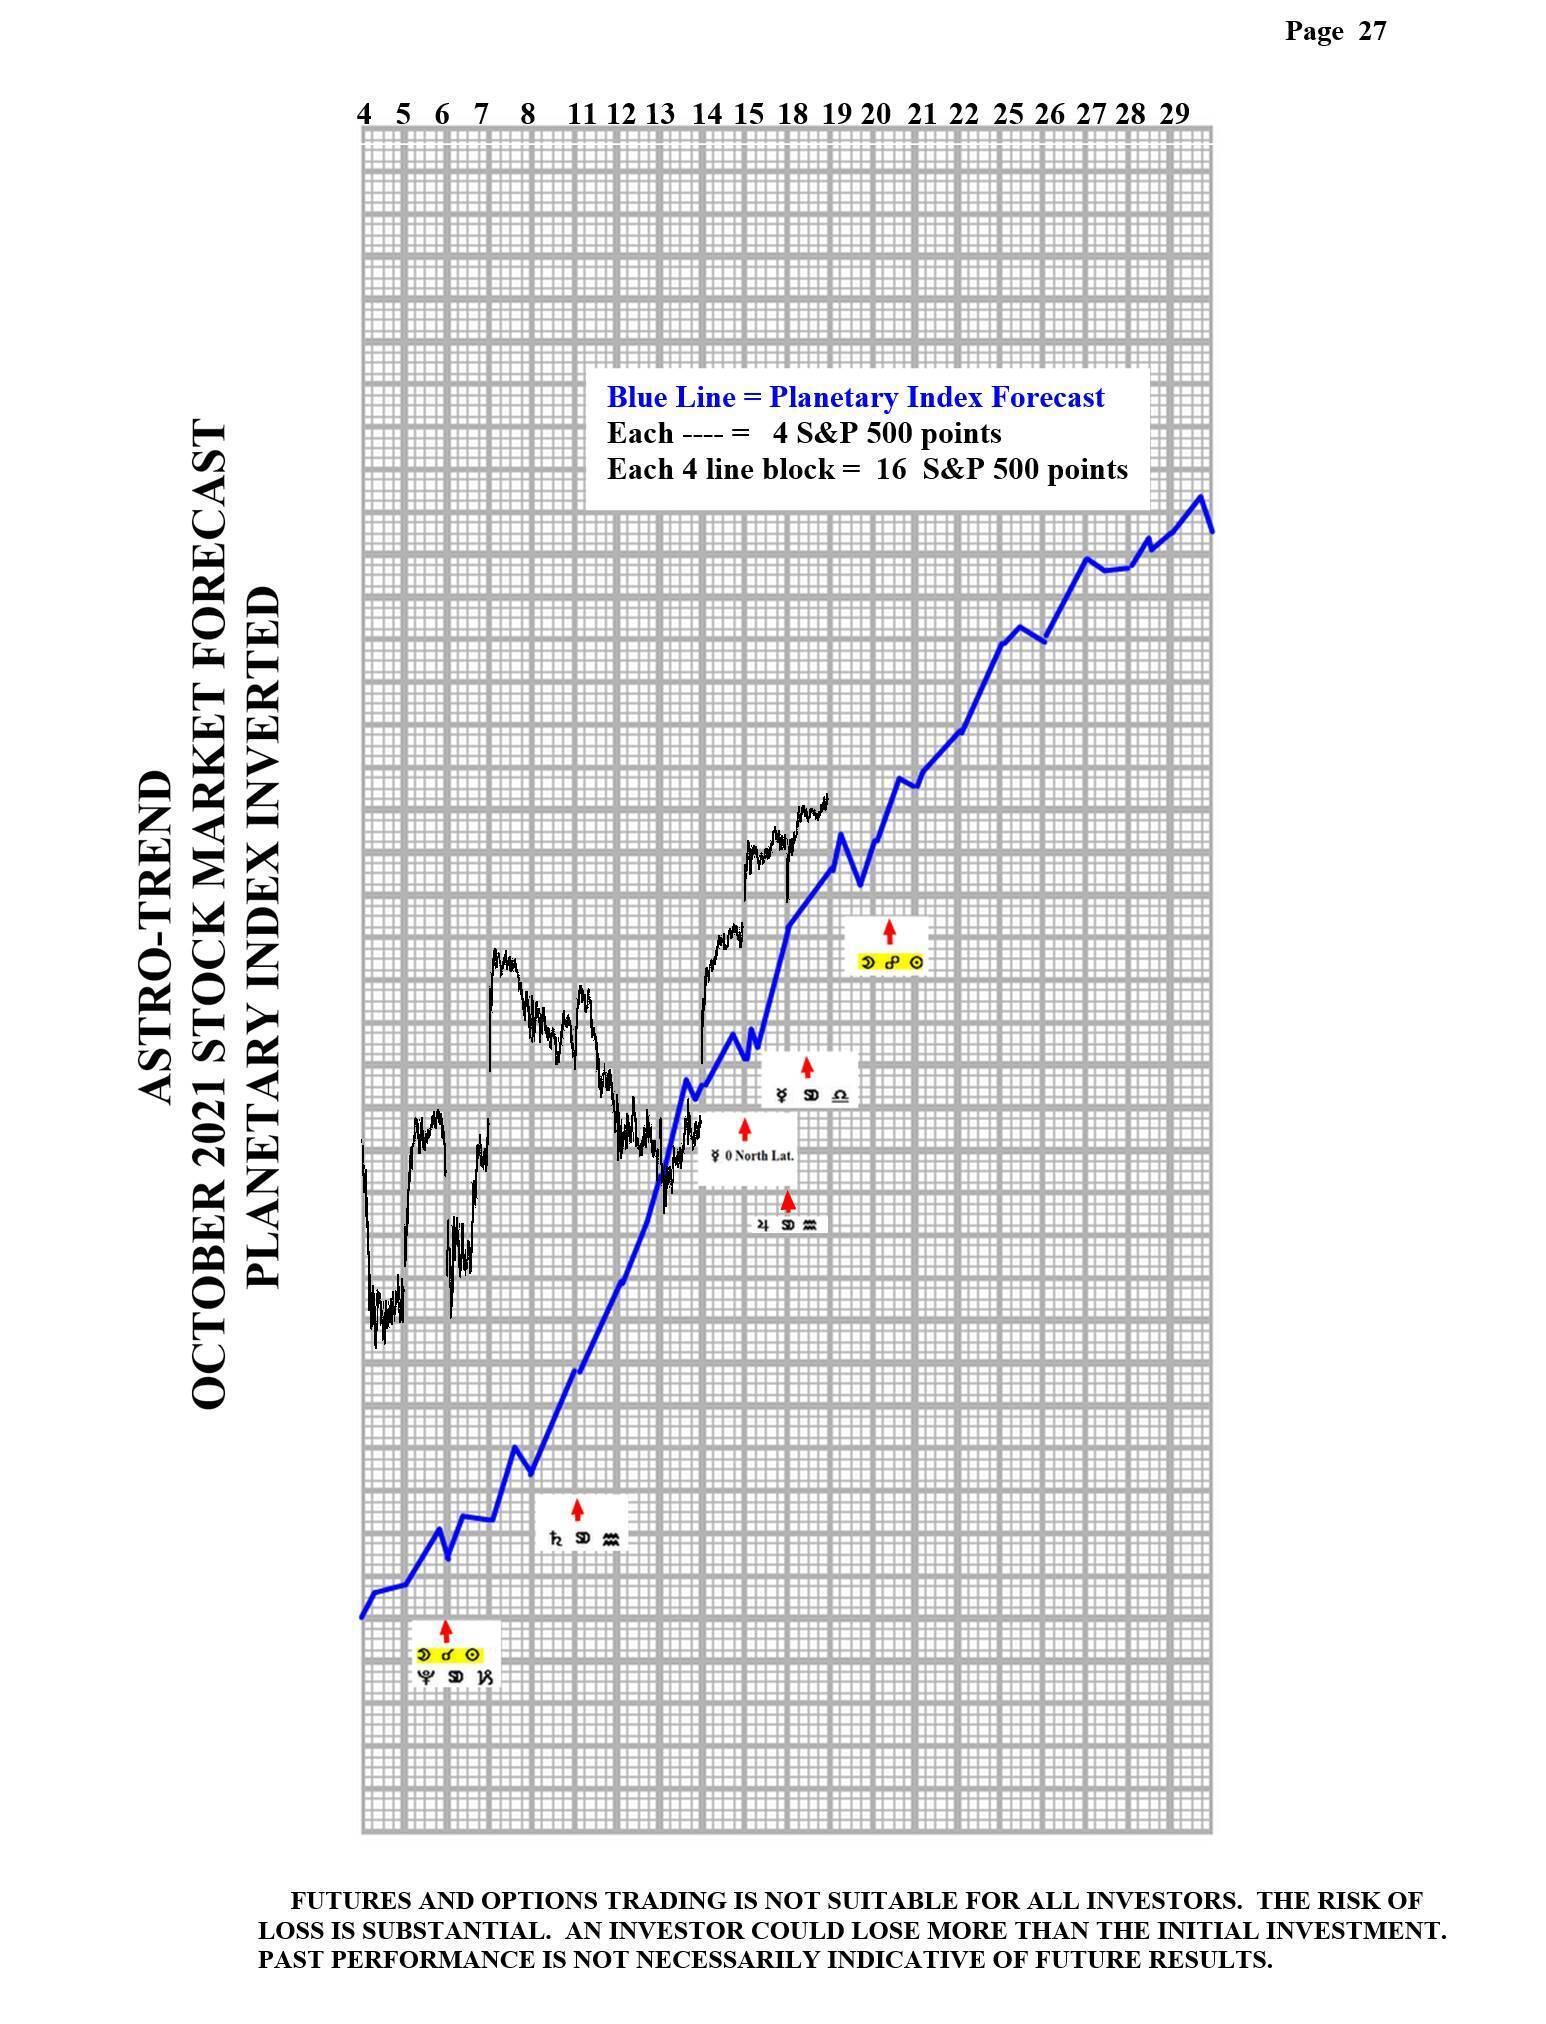
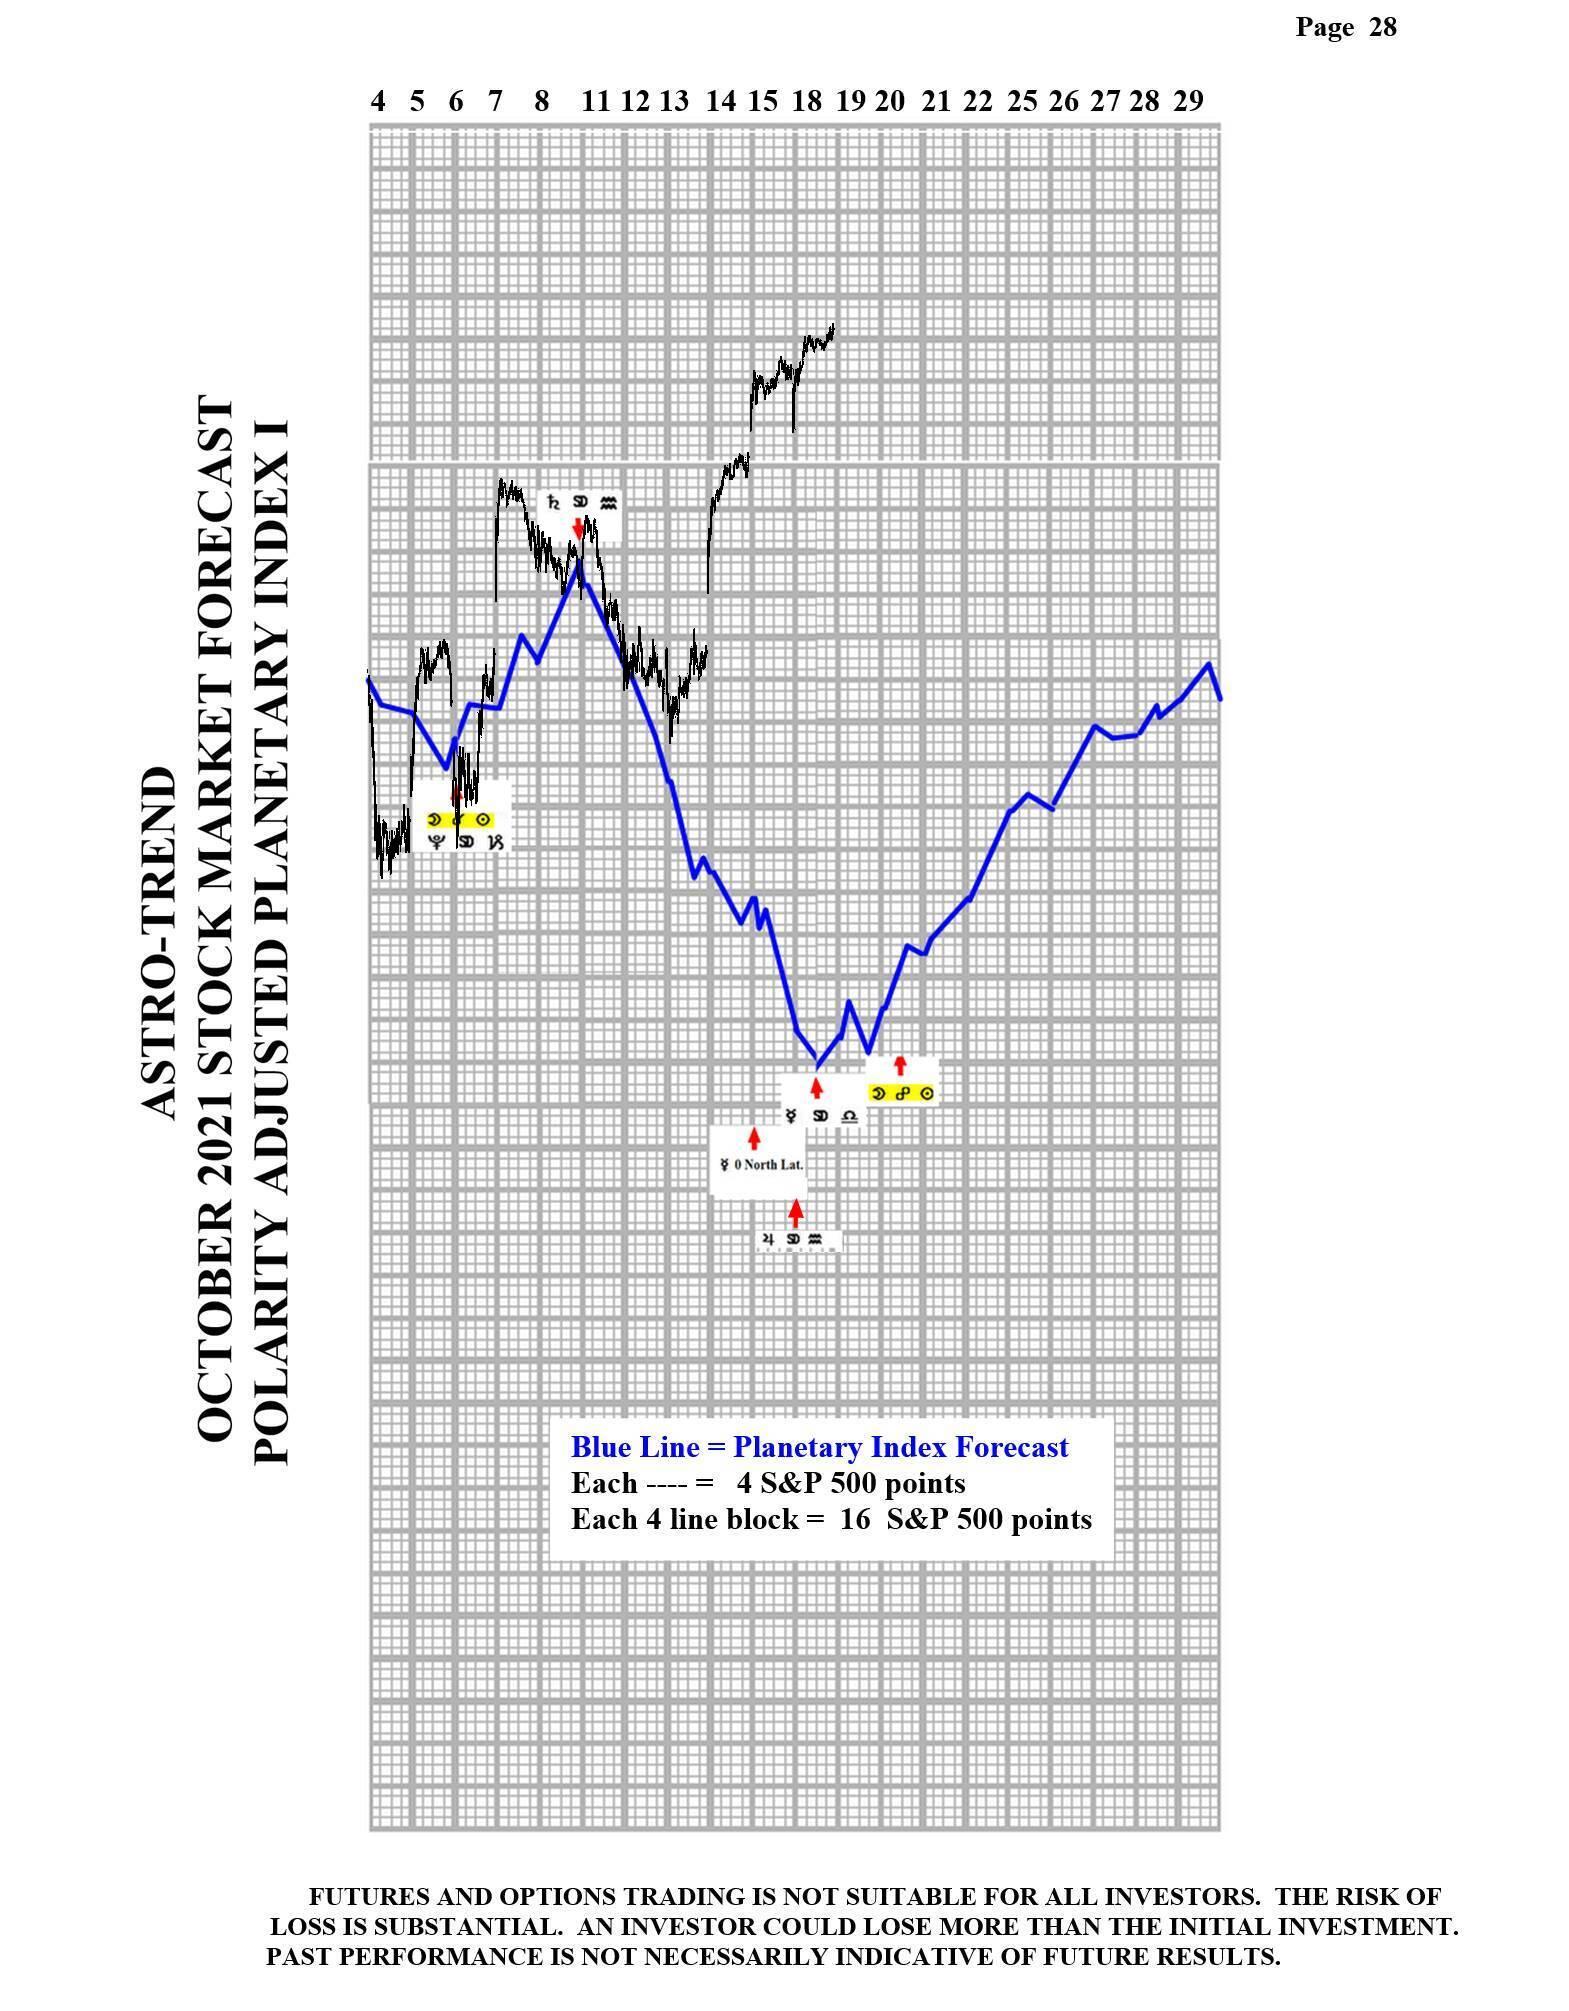
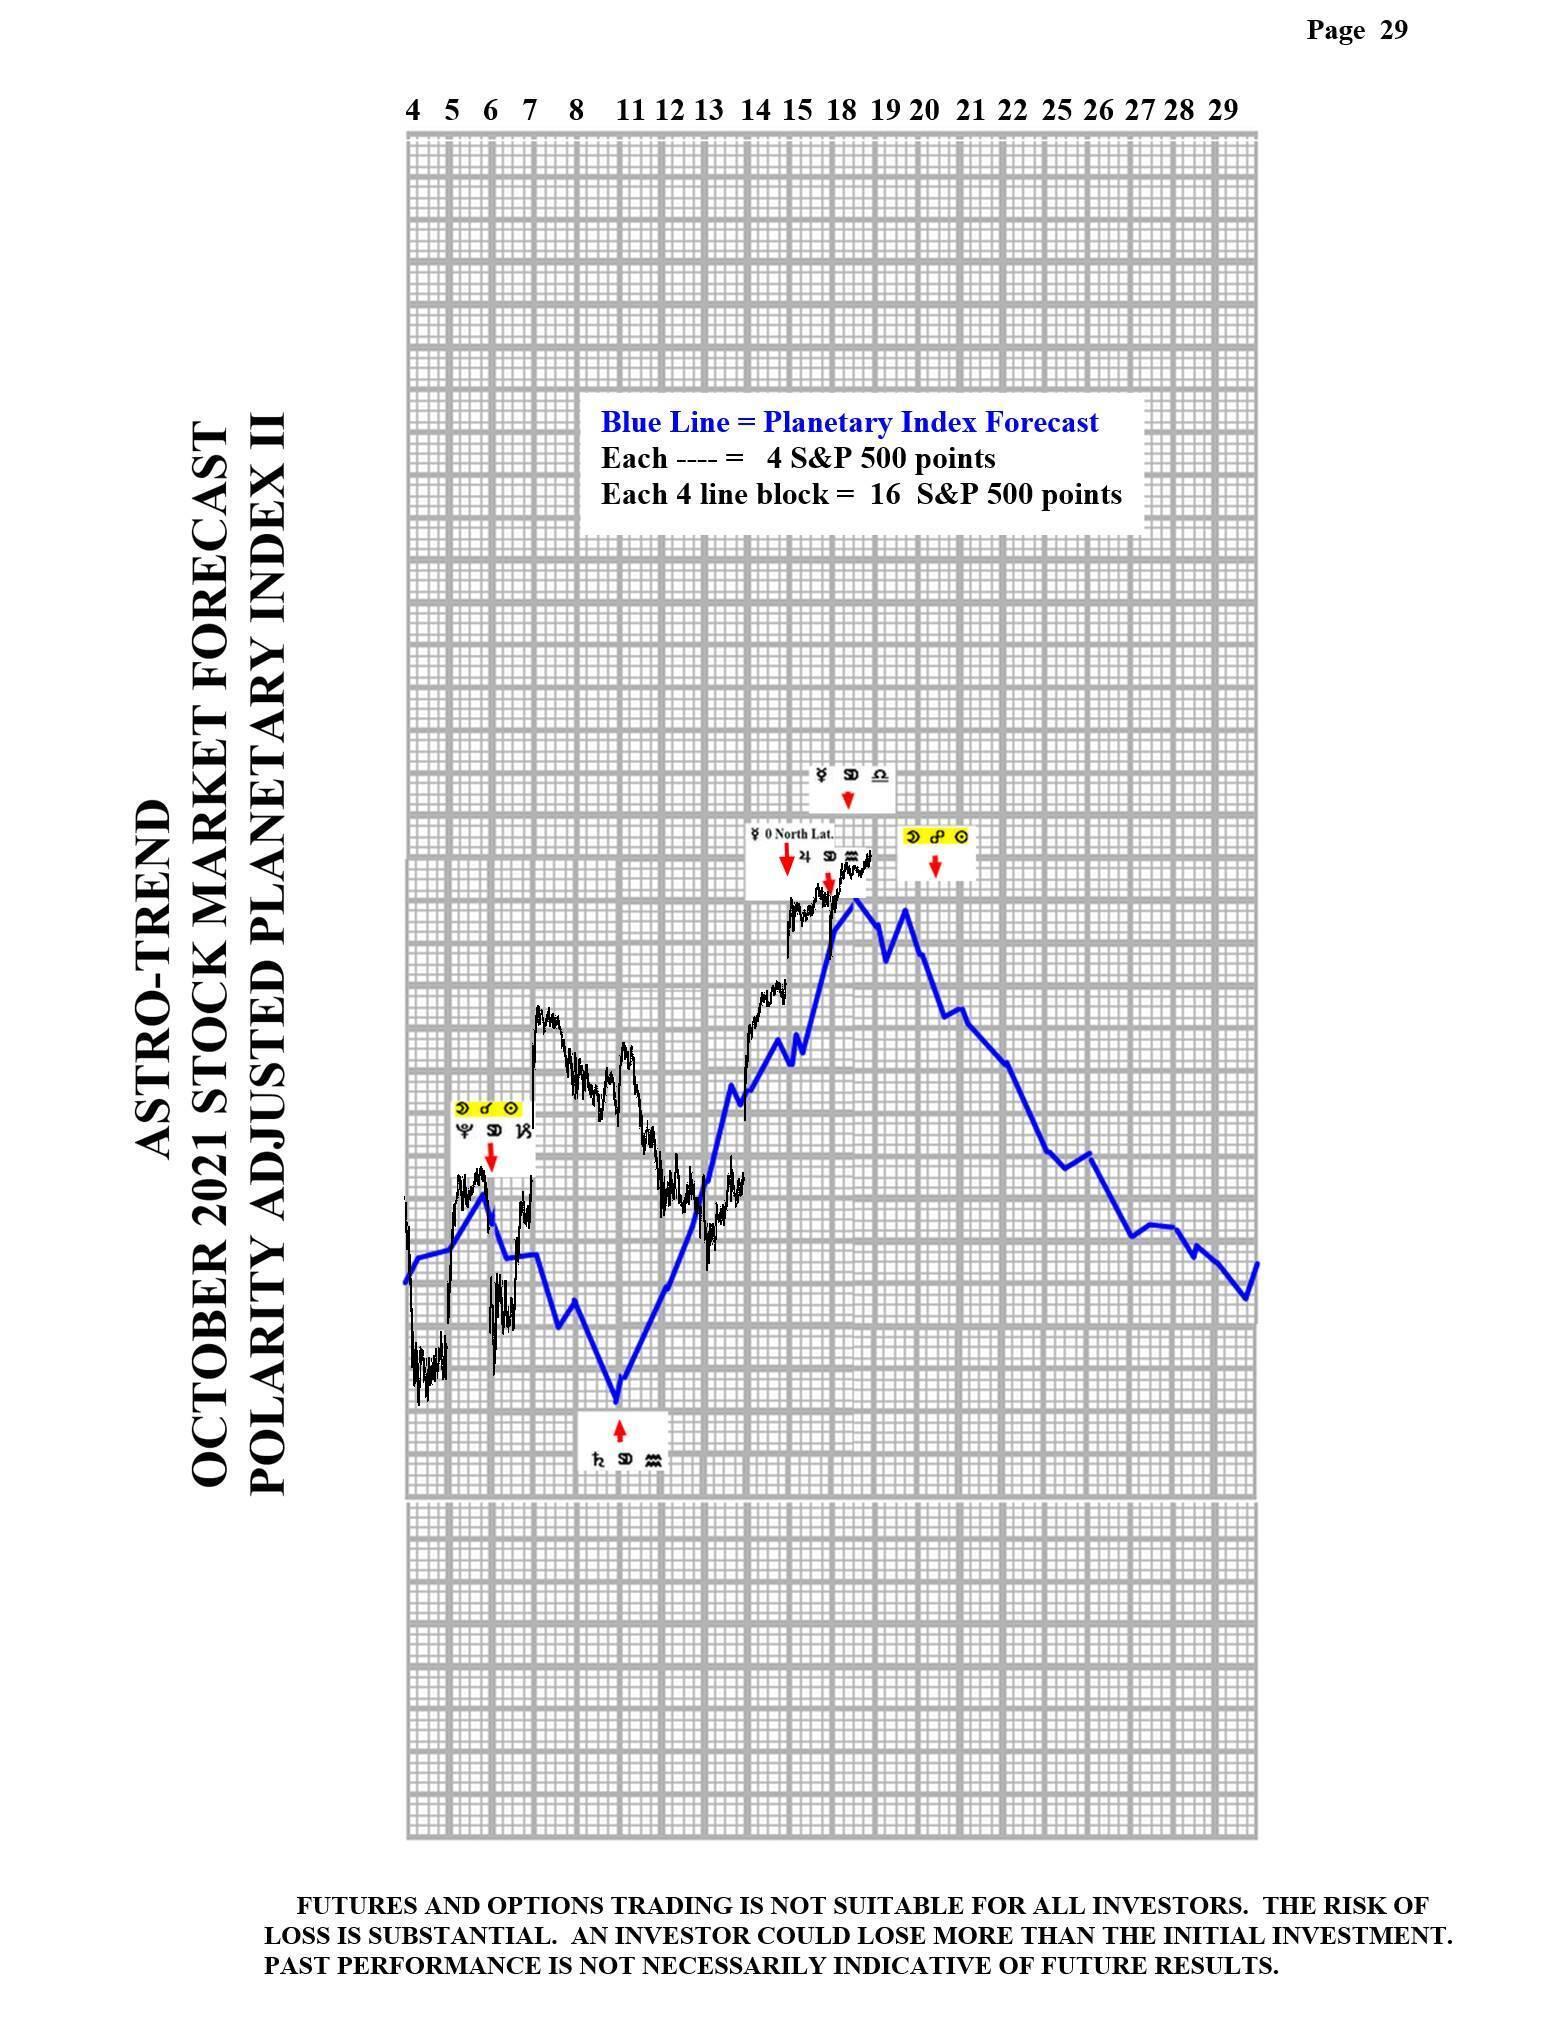
Please see below the Planetary Index charts with S&P 500 10 minute bars for results.

Chart
Chart
Chart
Chart

Author

Norm Winski

Norm Winski

Independent Analyst

www.astro-trend.com

More from Norm Winski
Share:

Editor's Picks

EUR/USD: US Dollar to remain pressured until uncertainty fog dissipates

Unimpressive European Central Bank left monetary policy unchanged for the fifth consecutive meeting. The United States first-tier employment and inflation data is scheduled for the second week of February. EUR/USD battles to remain afloat above 1.1800, sellers moving to the sidelines.

GBP/USD softens to near 1.3600 as BoE hints further rate cuts

The GBP/USD pair loses ground to near 1.3610 during the early Asian session on Monday. The Pound Sterling softens against the Greenback amid growing expectations of the Bank of England’s interest-rate cut. Traders will take more cues from the Fedspeak later on Monday.

Gold eyes acceptance above $5,000, kicking off a big week

Gold is consolidating the latest uptick at around the $5,000 mark, with buyers gathering pace for a sustained uptrend as a critical week kicks off. All eyes remain on the delayed Nonfarm Payrolls and Consumer Price Index data from the United States due on Wednesday and Friday, respectively.

Top Crypto Gainers: Aster, Decred, and Kaspa rise as selling pressure wanes

Altcoins such as Aster, Decred, and Kaspa are leading the broader cryptocurrency market recovery over the last 24 hours, as Bitcoin holds above $70,000 on Monday, up from the $60,000 dip on Thursday.

Weekly column: Saturn-Neptune and the end of the Dollar’s 15-year bull cycle

Tariffs are not only inflationary for a nation but also risk undermining the trust and credibility that go hand in hand with the responsibility of being the leading nation in the free world and controlling the world’s reserve currency.

Bitcoin, Ethereum and Ripple consolidate after massive sell-off

Bitcoin, Ethereum, and Ripple prices consolidated on Monday after correcting by nearly 9%, 8%, and 10% in the previous week, respectively. BTC is hovering around $70,000, while ETH and XRP are facing rejection at key levels. Traders should be cautious: despite recent stabilization, upside recovery for these top three cryptocurrencies is capped as the broader trend remains bearish.