Regional banks bang markets [Video]
![Regional banks bang markets [Video]](https://editorial.fxstreet.com/images/TechnicalAnalysis/Intermarket/Correlation/greasy-gears-in-the-machine-gm503847604-82780433.jpg)
US Dollar: Mar '23 USD is Up at 103.445.
Energies: Apr '23 Crude is Down at 73.12.
Financials: The Jun '23 30 Year T-Bond is Down 32 ticks and trading at 130.17.
Indices: The Mar '23 S&P 500 emini ES contract is 61 ticks Higher and trading at 3872.00.
Gold: The Apr'23 Gold contract is trading Down at 1905.20. Gold is 112 ticks Lower than its close.
Initial conclusion
This is not a correlated market. The dollar is Up, and Crude is Down which is normal, but the 30 Year T-Bond is trading Lower. The Financials should always correlate with the US dollar such that if the dollar is Higher, then the bonds should follow and vice-versa. The S&P is Higher, and Crude is trading Lower which is correlated. Gold is trading Lower which is correlated with the US dollar trading Up. I tend to believe that Gold has an inverse relationship with the US Dollar as when the US Dollar is down, Gold tends to rise in value and vice-versa. Think of it as a seesaw, when one is up the other should be down. I point this out to you to make you aware that when we don't have a correlated market, it means something is wrong. As traders you need to be aware of this and proceed with your eyes wide open. At the present time all of Asia is trading Lower. Currently all of Europe is trading Mixed.
Possible challenges to traders today
-
CPI m/m is out at 8:30 AM EST. This is Major.
-
CPI y/y is out at 8:30 AM EST. This is Major.
-
Core CPI m/m is out at 8:30 AM EST. Major.
Treasuries
Traders, please note that we've changed the Bond instrument from the 30 year (ZB) to the 10 year (ZN). They work exactly the same.
We've elected to switch gears a bit and show correlation between the 10-year bond (ZN) and the S&P futures contract. The S&P contract is the Standard and Poor's, and the purpose is to show reverse correlation between the two instruments. Remember it's likened to a seesaw, when up goes up the other should go down and vice versa.
Yesterday the ZN hit a Low at around 10 AM EST. The S&P was trading Higher at around the same time. If you look at the charts below ZN gave a signal at around 10 AM and the S&P gave a signal at around the same time. Look at the charts below and you'll see a pattern for both assets. ZN hit a Low at around 10 AM and migrated Higher. These charts represent the newest version of MultiCharts and I've changed the timeframe to a 15-minute chart to display better. This represented a Long opportunity on the 10-year note, as a trader you could have netted about 25 ticks per contract on this trade. Each tick is worth $15.625. Please note: the front month for the ZN is now Jun '23. The S&P contract is still Mar' 23. I've changed the format to filled Candlesticks (not hollow) such that it may be more apparent and visible.
Charts courtesy of MultiCharts built on an AMP platform
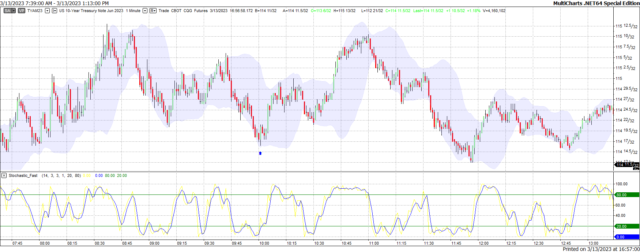
ZN - Jun 2023 - 3/13/23
-638143878752183989.png)
S&P - Mar 2023 - 3/13/23
Bias
Yesterday we gave the markets a Neutral or Mixed bias as we didn't much in the way of Market Correlation Monday morning. The markets didn't disappoint as the Dow closed Lower by 91 points, the S&P Lower by 6, but the Nasdaq was Higher by 50. All in all, it was a Neutral or Mixed day. Today we aren't dealing with a correlated market and our bias is to the Upside.
Could this change? Of Course. Remember anything can happen in a volatile market.
Commentary
Just as we were getting over the shock of the Jobs report on Friday; over the weekend we learn that two regional banks in California have gone "belly-up" so to speak. This set the tone for what happened yesterday in the markets. The markets should have gone Higher and probably would have if not for this news. It was learned that the management of Silicone Valley Bank sold their shares of this institution prior to the collapse and transferred those funds to another bank. President Biden addressed this issue prior to the market open and assured everyone that their deposits were safe and insured. He also made it clear that these banks would be investigated and those responsible would be brought to task. Time will tell how this all works out.
Author

Nick Mastrandrea
Market Tea Leaves
Nick Mastrandrea over 20 years experience in trading and formerly held a NASD Series 7. He currently holds a NJ Life, Health and Variable Authority. Nick is a published writer and his work has appeared in Futures Magazine, TraderPlanet and others.