Red hot sentiment, even more confirmations
When everyone gets on the same side of the boat – you want to be on the other side.
And right now, it looks like everyone didn’t just move to one side of the boat, but they invited everyone they knew to join them. At least, that is how it looks like when looking at the charts featuring silver stock ETFs: SIL (senior silver miners) and SILJ (junior and mid-tier silver miners).
They both rallied, and the conventional wisdom would have one thinking that if something rallied, then the situation for it must be bullish. In reality, this makes no sense. The fact that something rallied refers to the past – yes, they both rallied. But why would that make the outlook (referring to the future, not the past) bullish?
Will yesterday’s or last week’s move simply be repeated? If that was the case, there would be no tops and no declines – once the market had determined a direction, it would just keep moving without looking back.
And yet, we know from experience that this is not how things work – neither in life, nor on the markets. When things get too excessive, the opposite tends to happen, as most things in life – including markets – tend to work in cycles.
Rallies don’t equal bullishness
Breath in, breath out.
Rally, decline.
Of course, this doesn’t make rallies bearish, and it doesn’t make declines bullish. The point is that one should take context into account and examine whether a given market – or a group of markets – moved too far in one direction, which would make a move in the opposite direction likely. Depending on how far the market moved and what happened in previous similar circumstances in the past (if there were similar cases that is), then we might infer what’s likely to happen now.
Sure, the past doesn’t always repeat itself, and data regimes sometimes change, but it’s happening very rarely. In the vast majority of cases, “this time it’s different” are very expensive words coming out of investors’ mouths.
Yes, silver stocks rallied recently, but… Have they rallied too far? The price moves alone provide some insights, but that’s only a part of the story. The volume indications provide us with extra level of insight.
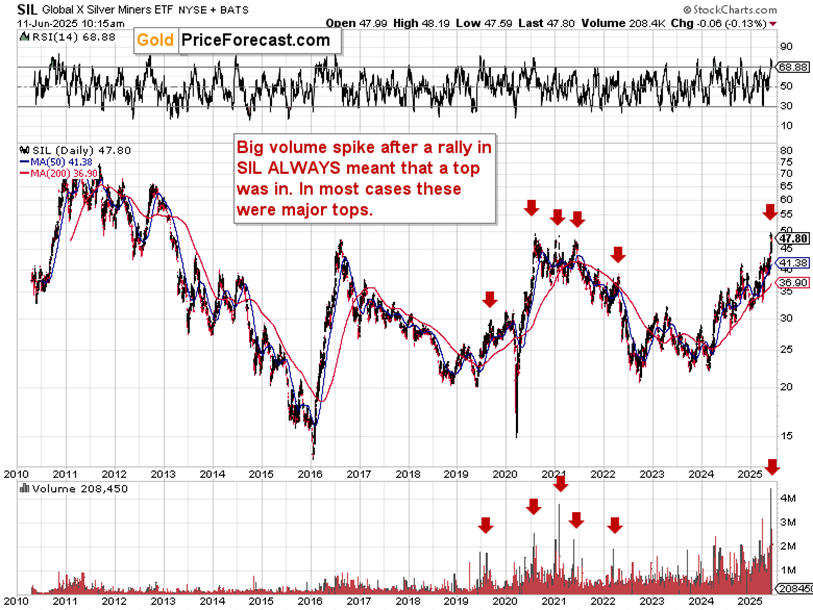
There two key things immediately popping out from the above chart:
- The SIL ETF (proxy for silver miners) moved to its 2016, 2020, and 2021 highs.
- We just saw a HUGE volume spike. In fact, that was the biggest daily volume in SIL EVER recorded since fund’s inception in 2010.
The second point is a huge deal as the volume spike is very characteristic. Consequently, it’s important to check when we saw something similar.
I marked all previous cases when we saw those volume spikes after rallies, and in each and every one of them that was the top. One time, it was just a local top (2019), but in the other four cases, those were all major tops and excellent shorting opportunities.
Three of them took place at the current price levels – at the resistance created by the 2016 high and the $50 level. Since this resistance worked several times, it got even stronger.
So, it’s not rocket science to see what’s likely to happen here – we’re very likely to have a major, medium-term top.
But PR, isn’t this an isolated case? Aren’t other markets showing something different?
No.
Other markets are showing us exactly the same thing. Take silver junior miners.
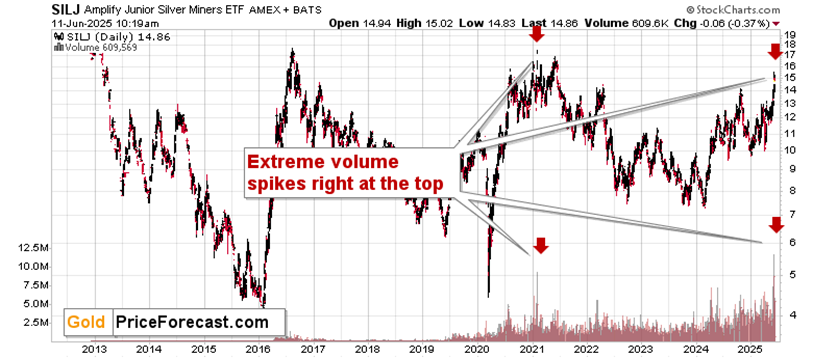
Once again, we see record volume, and there is only one case with a similarly extreme volume reading – that’s the 2021 top. The implications are clearly bearish – they confirm what we see on the previous chart.
Oh, and silver itself? It just rallied strongly relative to gold. Guess what happened in the previous cases when that happened?
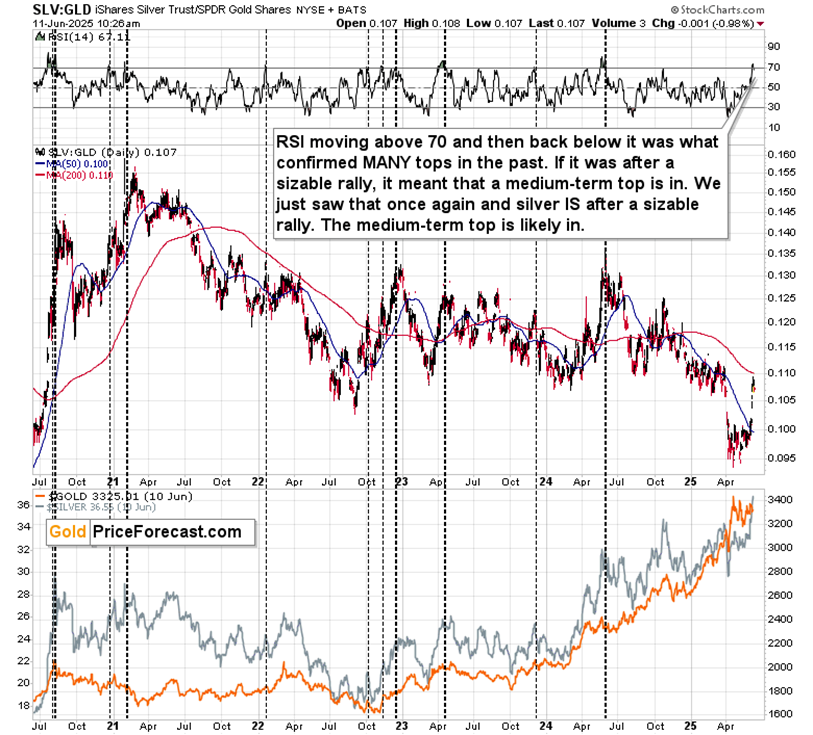
The above chart features the SLV to GLD ratio, and in this case, we need to adjust our top-detecting approach a bit.
RSI confirms the warning
The reason is that once silver is up and running, it’s not clear how far it can soar. Sometimes the RSI based on the ratio tops very close to 70, but sometimes it goes even well above this level.
What’s more reliable, therefore, is looking at times when the RSI moves back below 70 after trading above it. This IS the case right now, by the way.
What happened when we saw something like that in the recent years? I marked those cases with vertical, dashed lines. That’s right, you guessed it – in all case, we saw at least small declines. What’s much more important is that all those cases that happened after silver’s sizable rallies meant major tops. I marked that with thick lines.
And yes – this is what we saw at the early-2021 top, which confirms the analogy to this moment – just like SIL and SILJ volume spikes do.
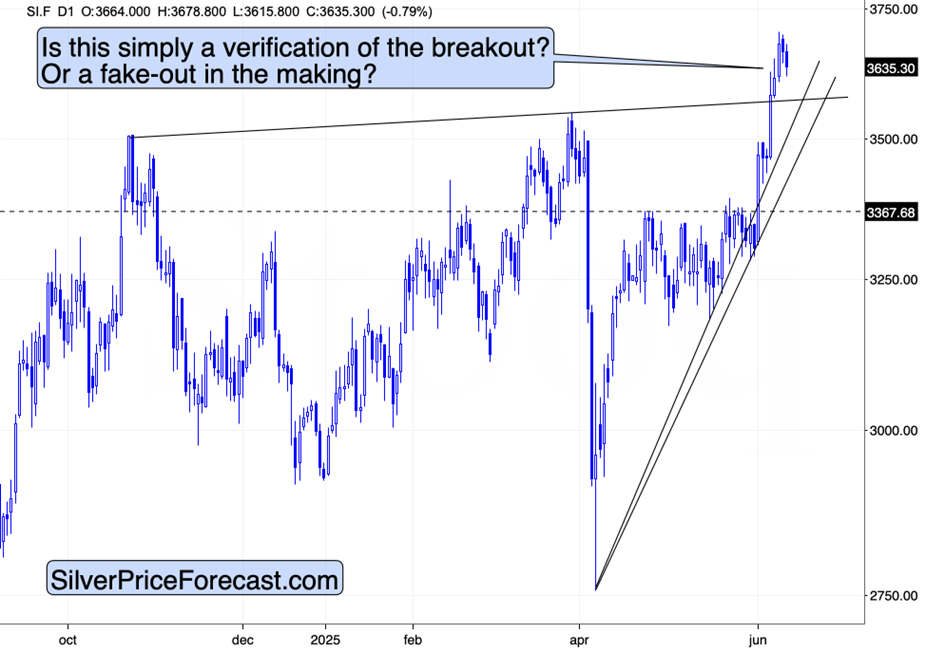
The key thing, however, is that the indications coming from the silver market are not alone – the recent run-up in platinum has just as bearish implications. Gold’s similarity to what happened in 2011-2013 tells us the same thing.
You know what else tells us that “this is it”?
The fact that silver is down today despite a move higher in stocks and a move lower in the USD Index.
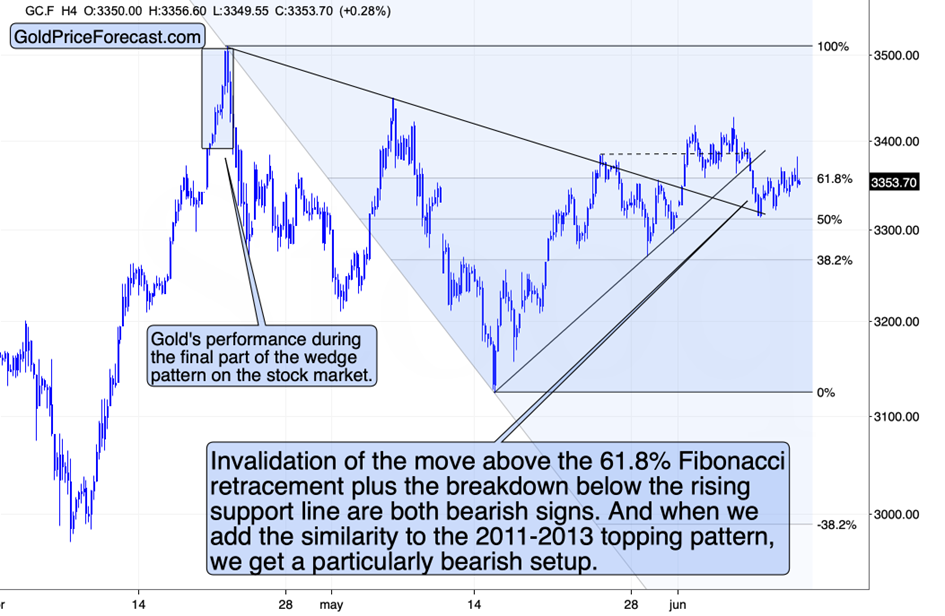
Gold is up, but insignificantly so. The link to 2011-2013 remains intact.
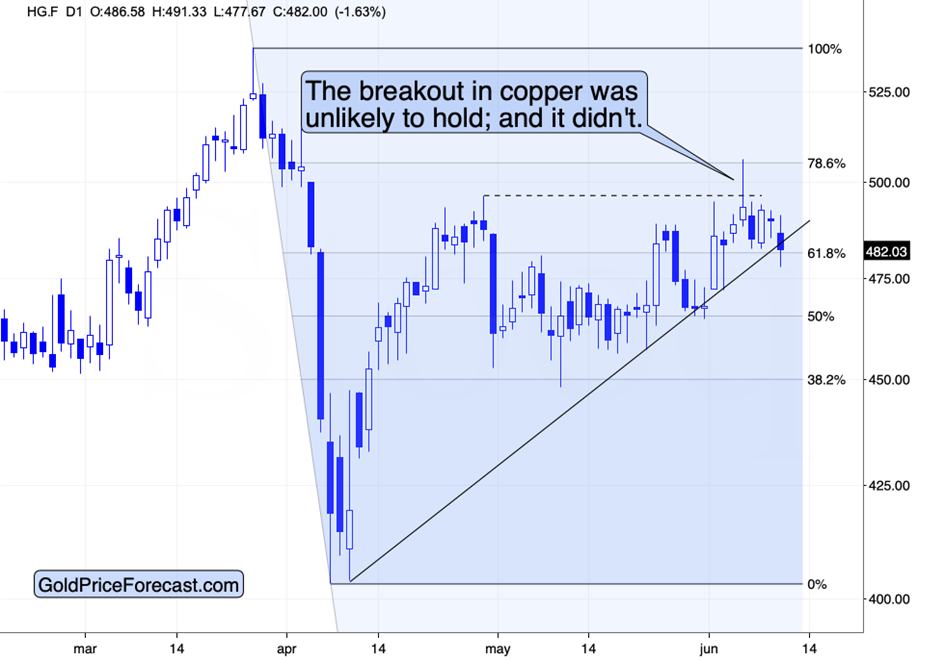
Copper is not only down, but it’s also breaking below its rising support line. It’s also likely to get back below its 61.8% Fibonacci retracement shortly.
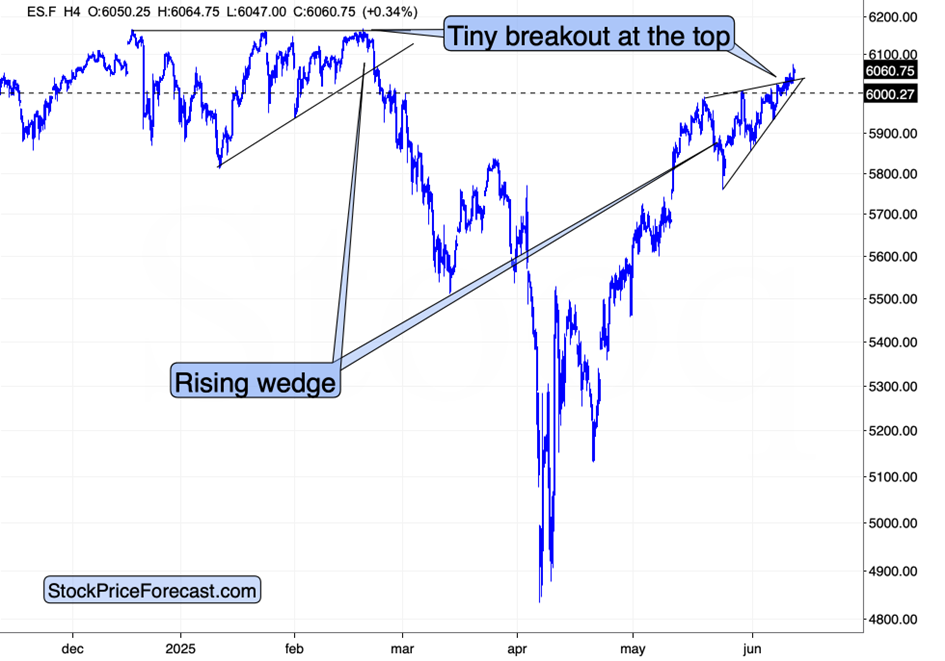
Meanwhile, stocks are breaking above their wedge pattern and then invalidating the breakout. Right now, we see another attempt to move higher.
All in all, it seems as if the precious metals were topping in the order of their size. Gold topped first, then silver topped, and now platinum is topping.
Confirmations of red-hot sentiment are everywhere if one cares to look. The investment public is here, buying like crazy, while the previously strong market (gold) is lagging.
These are exactly the times when you want to be doing the opposite of what the investment public is going.
I know that I’ve been wrong about many things in my career, timing included (hasn’t everyone in this profession?), but the current situation is confirmed by so many angles that NOT participating in the current opportunity is likely to look like a huge waste when looked at with the benefit of hindsight.
Of course, it’s your capital, and you can do with it as you please. However, if you have some physical gold/silver, you have your precious metals in an IRA for tax benefits, and you are willing to keep the sizes of your trading positions reasonable, the current opportunity to benefit from declining precious metals’ and mining stock prices is something you might regret not taking advantage of.
Want free follow-ups to the above article and details not available to 99%+ investors? Sign up to our free newsletter today!
Want free follow-ups to the above article and details not available to 99%+ investors? Sign up to our free newsletter today!
Author

Przemyslaw Radomski, CFA
Sunshine Profits
Przemyslaw Radomski, CFA (PR) is a precious metals investor and analyst who takes advantage of the emotionality on the markets, and invites you to do the same. His company, Sunshine Profits, publishes analytical software that any


