Real Estate Numbers Doesn’t Help [Video]
![Real Estate Numbers Doesn’t Help [Video]](https://editorial.fxstreet.com/images/Resources/colorful-apartment-building-gm478635225-36003224_XtraLarge.jpg)
US Dollar: Sept USD is Down at 96.780.
Energies: Aug '19 Crude is Up at 56.87.
Financials: The Sept 30 year bond is Up 1 tick and trading at 154.25.
Indices: The Sept S&P 500 emini ES contract is 15 ticks Lower and trading at 2981.50.
Gold: The Aug Gold contract is trading Down at 1422.30. Gold is 10 ticks Lower than its close.
Initial Conclusion
This is not a correlated market. The dollar is Down- and Crude is Up+ which is normal but the 30 year Bond is trading Higher. The Financials should always correlate with the US dollar such that if the dollar is lower then bonds should follow and vice-versa. The S&P is Lower and Crude is trading Higher which is correlated. Gold is trading Lower which is not correlated with the US dollar trading Down. I tend to believe that Gold has an inverse relationship with the US Dollar as when the US Dollar is down, Gold tends to rise in value and vice-versa. Think of it as a seesaw, when one is up the other should be down. I point this out to you to make you aware that when we don't have a correlated market, it means something is wrong. As traders you need to be aware of this and proceed with your eyes wide open.
Currently all of Asia is trading Lower as is all of Europe.
Possible Challenges To Traders Today
-
Philly Fed Manufacturing Index is out at 8:30 AM EST. This is major.
-
Unemployment Claims is out at 8:30 AM EST. This is major.
-
CB Leading Index m/m is out at 10 AM EST. This is major.
-
Nat Gas Storage is out at 10:30 AM EST. This is major.
-
FOMC Member Williams Speaks at 2:15 PM EST. This is major.
Treasuries
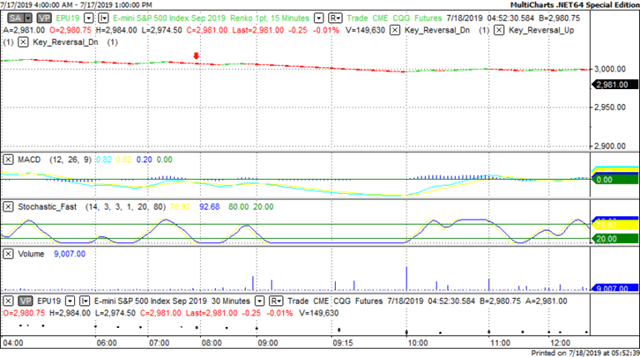
We've elected to switch gears a bit and show correlation between the 30 year bond (ZB) and The YM futures contract. The YM contract is the DJIA and the purpose is to show reverse correlation between the two instruments. Remember it's liken to a seesaw, when up goes up the other should go down and vice versa.
Yesterday the ZB made a major move at around 8 AM EST. The ZB hit a Low at around that time and the YM hit a High. If you look at the charts below ZB gave a signal at around 8 AM EST and the YM was moving Lower at the same time. Look at the charts below and you'll see a pattern for both assets. ZB hit a Low at around 8 AM and the YM was moving Lower at the same time. These charts represent the newest version of MultiCharts and I've changed the timeframe to a 15 minute chart to display better. This represented a Long opportunity on the 30 year bond, as a trader you could have netted about 20 plus ticks per contract on this trade. Each tick is worth $31.25. Please note: the front month for both the ZB and YM contract is now September, 2019 and I've changed the format to Renko bars such that it may be more apparent and visible.
Charts Courtesy of MultiCharts built on an AMP platform.
-636990440628463721.png)
Bias
Yesterday our bias was Neutral as we saw no signs of market correlation in the early AM. The Dow dropped 67 points and the other indices lost ground as well. Today we aren't dealing with a correlated market and our bias is Neutral. Today we aren't dealing with a correlated market and will maintain a Neutral bias.
Could this change? Of Course. Remember anything can happen in a volatile market.
Commentary
It would appear as though the drop off we saw on Tuesday has definitely grown not only for the US markets but for the global exchanges as well. Yesterday the Dow dropped 67 points and the other indices didn't fare much better. We had Build Permits and Housing Start numbers that did not meet expectation and certainly this didn't help. The US economy is still dependent very heavily on the health of the real estate market and as such when those markets don't do well you can rest assured that the rest of the markets will follow. Are we surprised by this? No. Whatever goes up must assuredly at some point go down and vice versa.
Author

Nick Mastrandrea
Market Tea Leaves


