Reading the tea leaves of Gold’s upcoming move

To be bullish or not to be – that is the question. Or it might have been the question, if someone named Shakespeare wrote a piece titled Investhamlet.
The choice whether to be bullish or bearish or neutral on a given asset should be made each day, each time based on the information that is currently available. Let’s check the new signs that we saw yesterday.
First of all, we just saw a bearish sign from the general stocks market.
The Sign from Stocks
-637255811261363923.png)
The huge price gap that we saw on Monday seems very encouraging, but please keep in mind that the S&P 500 once again failed to close the bearish price gap that it had opened in the first half of March. So, should one trust Monday’s bullish price gap? It seems too early in our view. The above-mentioned resistance is strengthened by the late-April high, and the S&P 500 futures moved lower yesterday.
And by “moved lower yesterday” we actually mean, they reversed in a way that’s quite profound in case of the S&P 500 futures.
-637255811049320110.png)
The shooting star candlestick in the stock market futures points to a change in the trend, especially since stocks invalidated the tiny breakout above the late-April high and the 61.8% Fibonacci retracement level.
Also, please note the increase in volume on the previous chart – we saw the same thing at two April highs. Perhaps we’re seeing yet another high, instead of a beginning of a new upswing. We shall know soon enough – stocks are trading between the price gaps and they are likely to break out or break down sooner rather than later.
The implications for silver and mining stocks – which are more connected with the general stock market than gold is – are bearish.
While stocks reversed, the USD Index moved lower once again.
The USDX Bidding Its Time
-637255810776335905.png)
The USDX moved below its 50-day moving average (marked with blue) and it closed there for the second day. That’s important, because that’s USD’s fourth attempt to break below this moving average and confirm the breakdown. The first two attempts took place in late March and in early April, and the breakdowns were invalidated on the next trading day in both cases. The third attempt took place about 3 weeks ago, and this time the breakdown was invalidated on the third day.
Will this time be different and the breakdown below the 50-day MA gets confirmed? We doubt it. The history repeats itself, after all, and a given pattern remains in place until it is clearly broken. This time, it seems that the USD Index will reverse once again, especially given its long-term breakout. The latter is likely to make the USD Index move much higher in the following months (possibly years), not only weeks. This doesn’t mean that we expect gold to decline in the long run, though. We think that a quicker 1-3-week-long decline is in the cards, but nothing more. It’s likely to be significant, though.
The implications of the most recent developments in the USD Index are bearish for the precious metals market.
As you can see in the lower part of the above chart, gold moved higher yesterday, but it moved up rather insignificantly. Gold futures were up by precisely $11.20, which means that they didn’t erase Monday’s decline.
Meanwhile in Precious Metals
-637255810377249802.png)
Gold’s unwillingness to react to USD’s bullish lead can be viewed as bearish. The same goes for the sell signal from the Stochastic indicator. These signals that took place after Stochastic was close to the 80 level, were followed by quite visible declines in gold.
Consequently, the implications of yesterday’s session – and this week’s developments in gold – are bearish.
Then there’s silver that’s soaring like there’s no tomorrow and miners that just confirmed their breakout above the previous May highs.
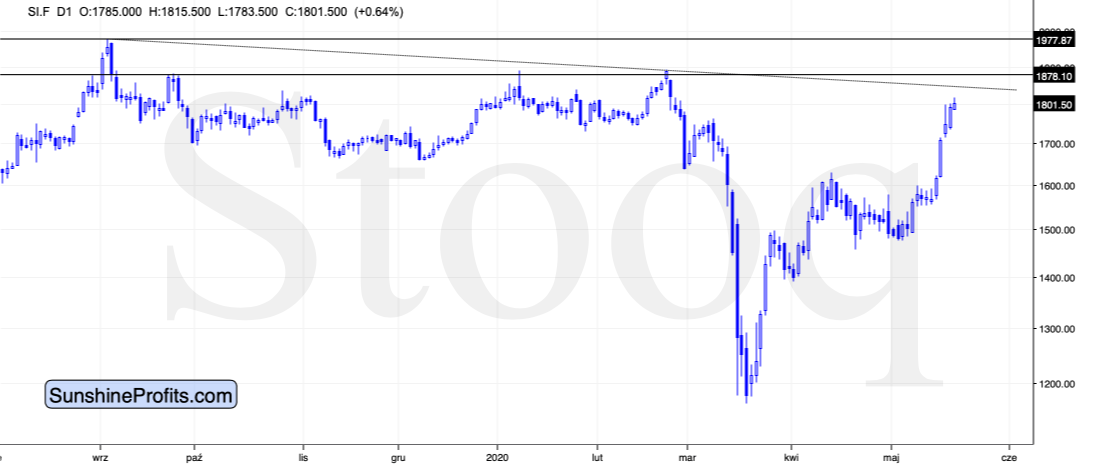
Silver moved higher right after forming the daily reversal and it even moved above the intraday high earlier today. Silver is clearly outperforming gold. In case of the gold to silver ratio that’s based on futures, we saw a move slightly below 100, and in case of the ratio based on the spot prices, the ratio just touched the 100 level a few hours ago, and then it moved back up.
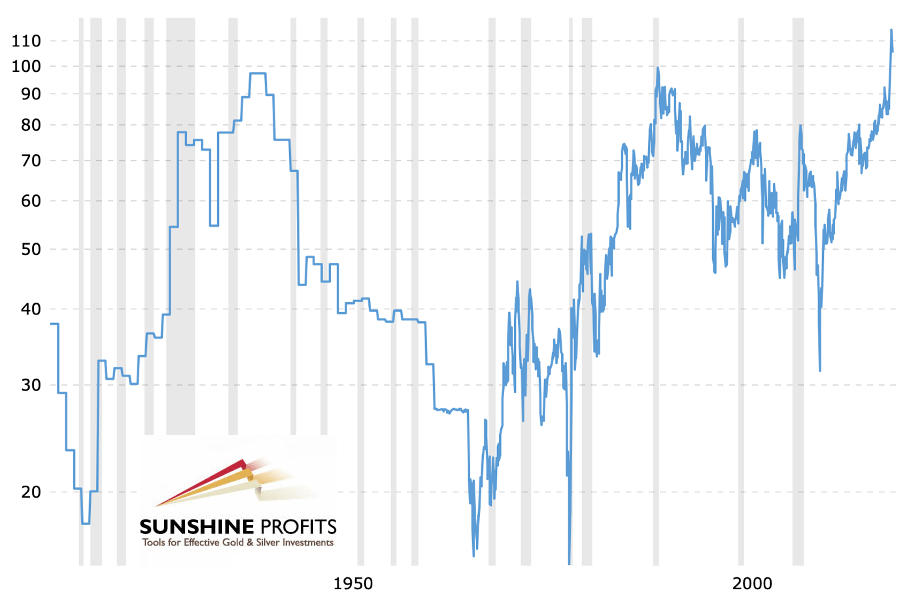
On one hand, the breakout above the 100 level in the gold to silver ratio seems to have been just verified, and it’s bullish.
On the other hand, silver reversed slightly above $18, which doesn’t correspond to a major resistance level. This means that the white metal could still move higher before topping. There are several resistance levels visible on the previous silver chart – between about $18,50 and about $20. Will silver really move as high shortly?
If the USD Index is bottoming and the general stock market is topping, then the above is very doubtful. In fact, silver’s relative strength on its own makes the short-term picture for the precious metals market rather bearish, because silver usually plays major catch-ups with gold in the final part of the rally. It definitely happened already and the extent to which silver outperformed gold, was clear and loud. Consequently, the top might already be in after all, as the 100 level in the gold to silver ratio is more important than any of the above-market individual silver resistance levels.
This leaves us with the bullish implications of yesterday’s move in the mining stocks.
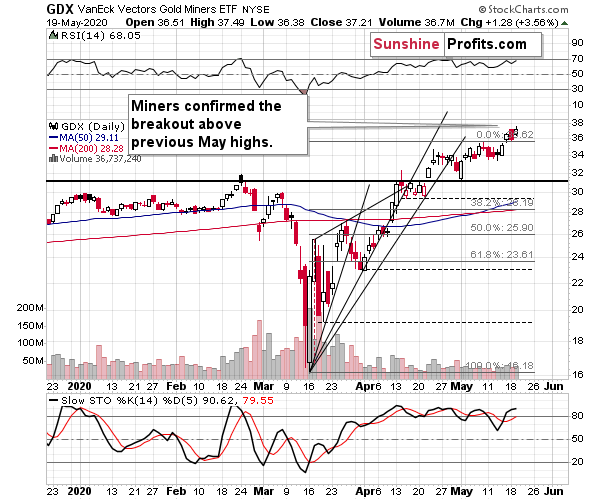
There are two possibilities at this moment. Either the GDX ETF is breaking substantially higher here… Or it’s providing us with fake strength at the very end of the move.
Yes, the link between gold and gold miners is not as straightforward as it seems at first sight. On average, miners do tend to be weak sooner than gold during its rallies. However, there’s also this very final part of the upswing, in which miners fake their strength. Let’s take a closer look at this phenomenon. The chart below features gold and the HUI Index – proxy for gold stocks.
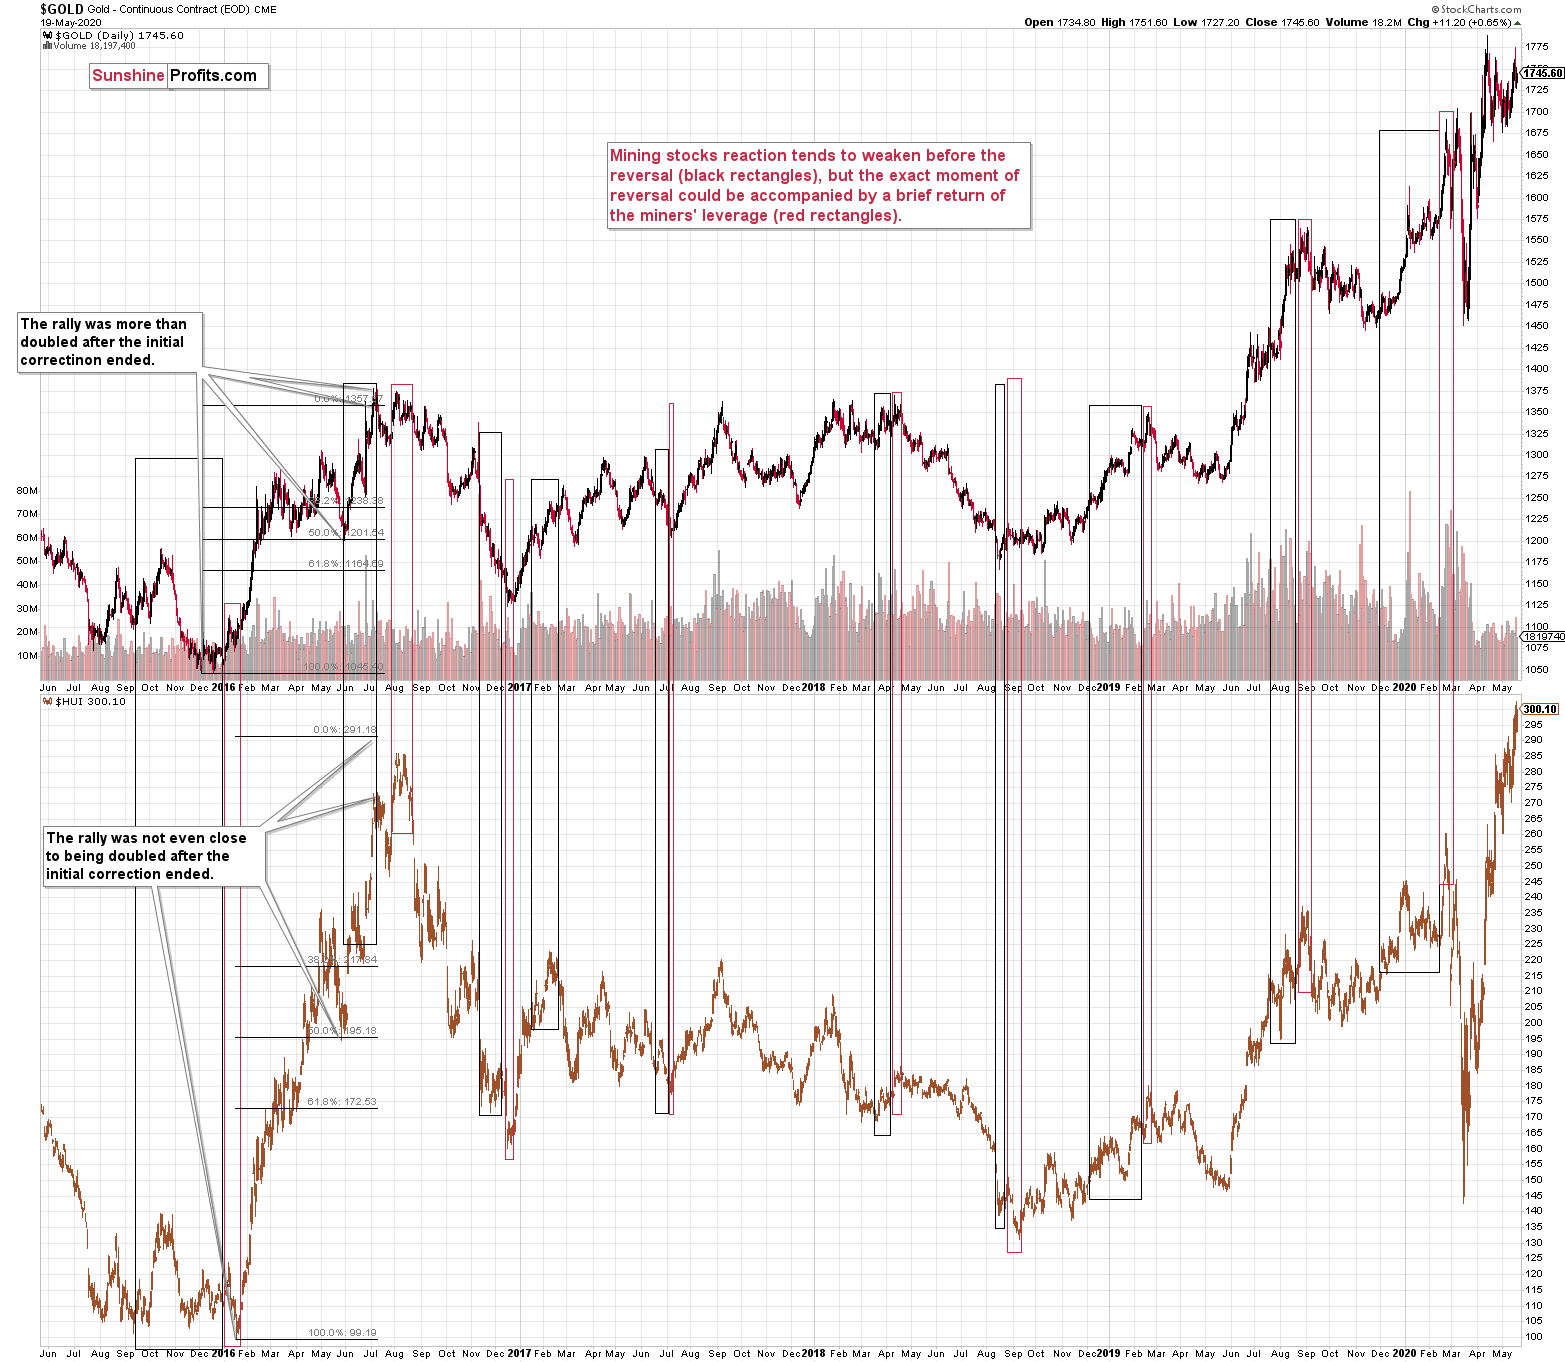
The above-mentioned link works both ways. That’s how the 2015/2016 decline ended. Miners underperformed in the first days of January and this was a fake move. That’s also how the February-March decline started – with gold miners’ outperformance. And that’s how many other moves in gold and gold miners have ended.
The black rectangles show periods when gold miners refused to fully follow gold’s lead, and the red rectangles show when gold miners temporarily multiplied gold’s signals.
So, is miners’ “strength” really “strength” to the full extent of this word’s definition? Given all the other points made today, this still seems doubtful.
Want free follow-ups to the above article and details not available to 99%+ investors? Sign up to our free newsletter today!
Want free follow-ups to the above article and details not available to 99%+ investors? Sign up to our free newsletter today!
Author

Przemyslaw Radomski, CFA
Gold Price Forecast
Przemyslaw Radomski, CFA (PR) is a precious metals investor and analyst who takes advantage of the emotionality on the markets, and invites you to do the same. His company, Sunshine Profits, publishes analytical software that any


