RBNZ set to continue easing this week – NZD/USD eyeing resistance

Following the RBNZ cutting its Official Cash Rate (OCR) by 50 basis points (bps) in November 2024, economists and investors expect another bumper 50 bp rate reductionon Wednesday this week – with an outside chance of a more minor 25 bp reduction.A 50 bp (25 bp) adjustment would bring the OCR to 3.75% (4.00%). In addition, markets are also expecting another 75 bps worth of cuts this year.
Sluggish economic activity
I’ve observed little reason to stray from market pricing and expect an additional 50 bp cut this week. Gross Domestic Product (GDP) growth fell into a technical recession in Q3 24 after printing a second consecutive quarter in negative territory; the -1.5% contraction was the lowest figure since Q2 20. Additionally, unemployment has risen to its highest level since late 2020 at 5.1% (Q4 24), and given inflation remains within the RBNZ’s 1-3% target band – Q4 24 inflation increased to 2.2% (matching the 2.2% print in Q3 24) – the central bank has ‘room’ to lower the OCR.
With a 50 bp cut largely baked in, and assuming the central bank follows through, I expect a knee-jerk sell-off across New Zealand dollar (NZD) pairs. That said, most focus will be on anychange in the rate statement’s language, press conference commentary, and any revisions in the updated economic projections.
NZD/USD vulnerable to the downside
Price action on the monthly timeframe for the NZD/USD (New Zealand dollar versus the US dollar) came within a stone’s throw of testing long-term support from US$0.5511 this month. Anyone following candlestick patterns may note that the current monthly candle is poised to close by way of a bullish engulfing formation. While monthly support is clear, and the bullish engulfing pattern indicates buyers may want to explore higher terrain, the rebound in October 2022 failing to print a meaningful high may concern long-term bulls. Couple this with the overall long-term trend facing south, and any higher rebound could be short-lived.
This brings me to the daily timeframe’s structure. Friday wrapped up pencilling in a dominant higher high (US$0.5738), reaching levels not seen since December 2024. What I also find interesting is although we have a higher high, this move represents a possible D-leg to an equal AB=CD resistance between a 200% extension ratio of US$0.5804 and horizontal resistance at US$0.5774, along with a 100% projection ratio (the equal AB=CD structure) at US$0.5789 nestled within the zone.
Consequently, although monthly price is testing a support area, my base case is that the path ofleast resistance remains to the downside for the NZD/USD. Daily resistance between US$0.5804 and US$0.5774, therefore, will be on my watchlist this week.
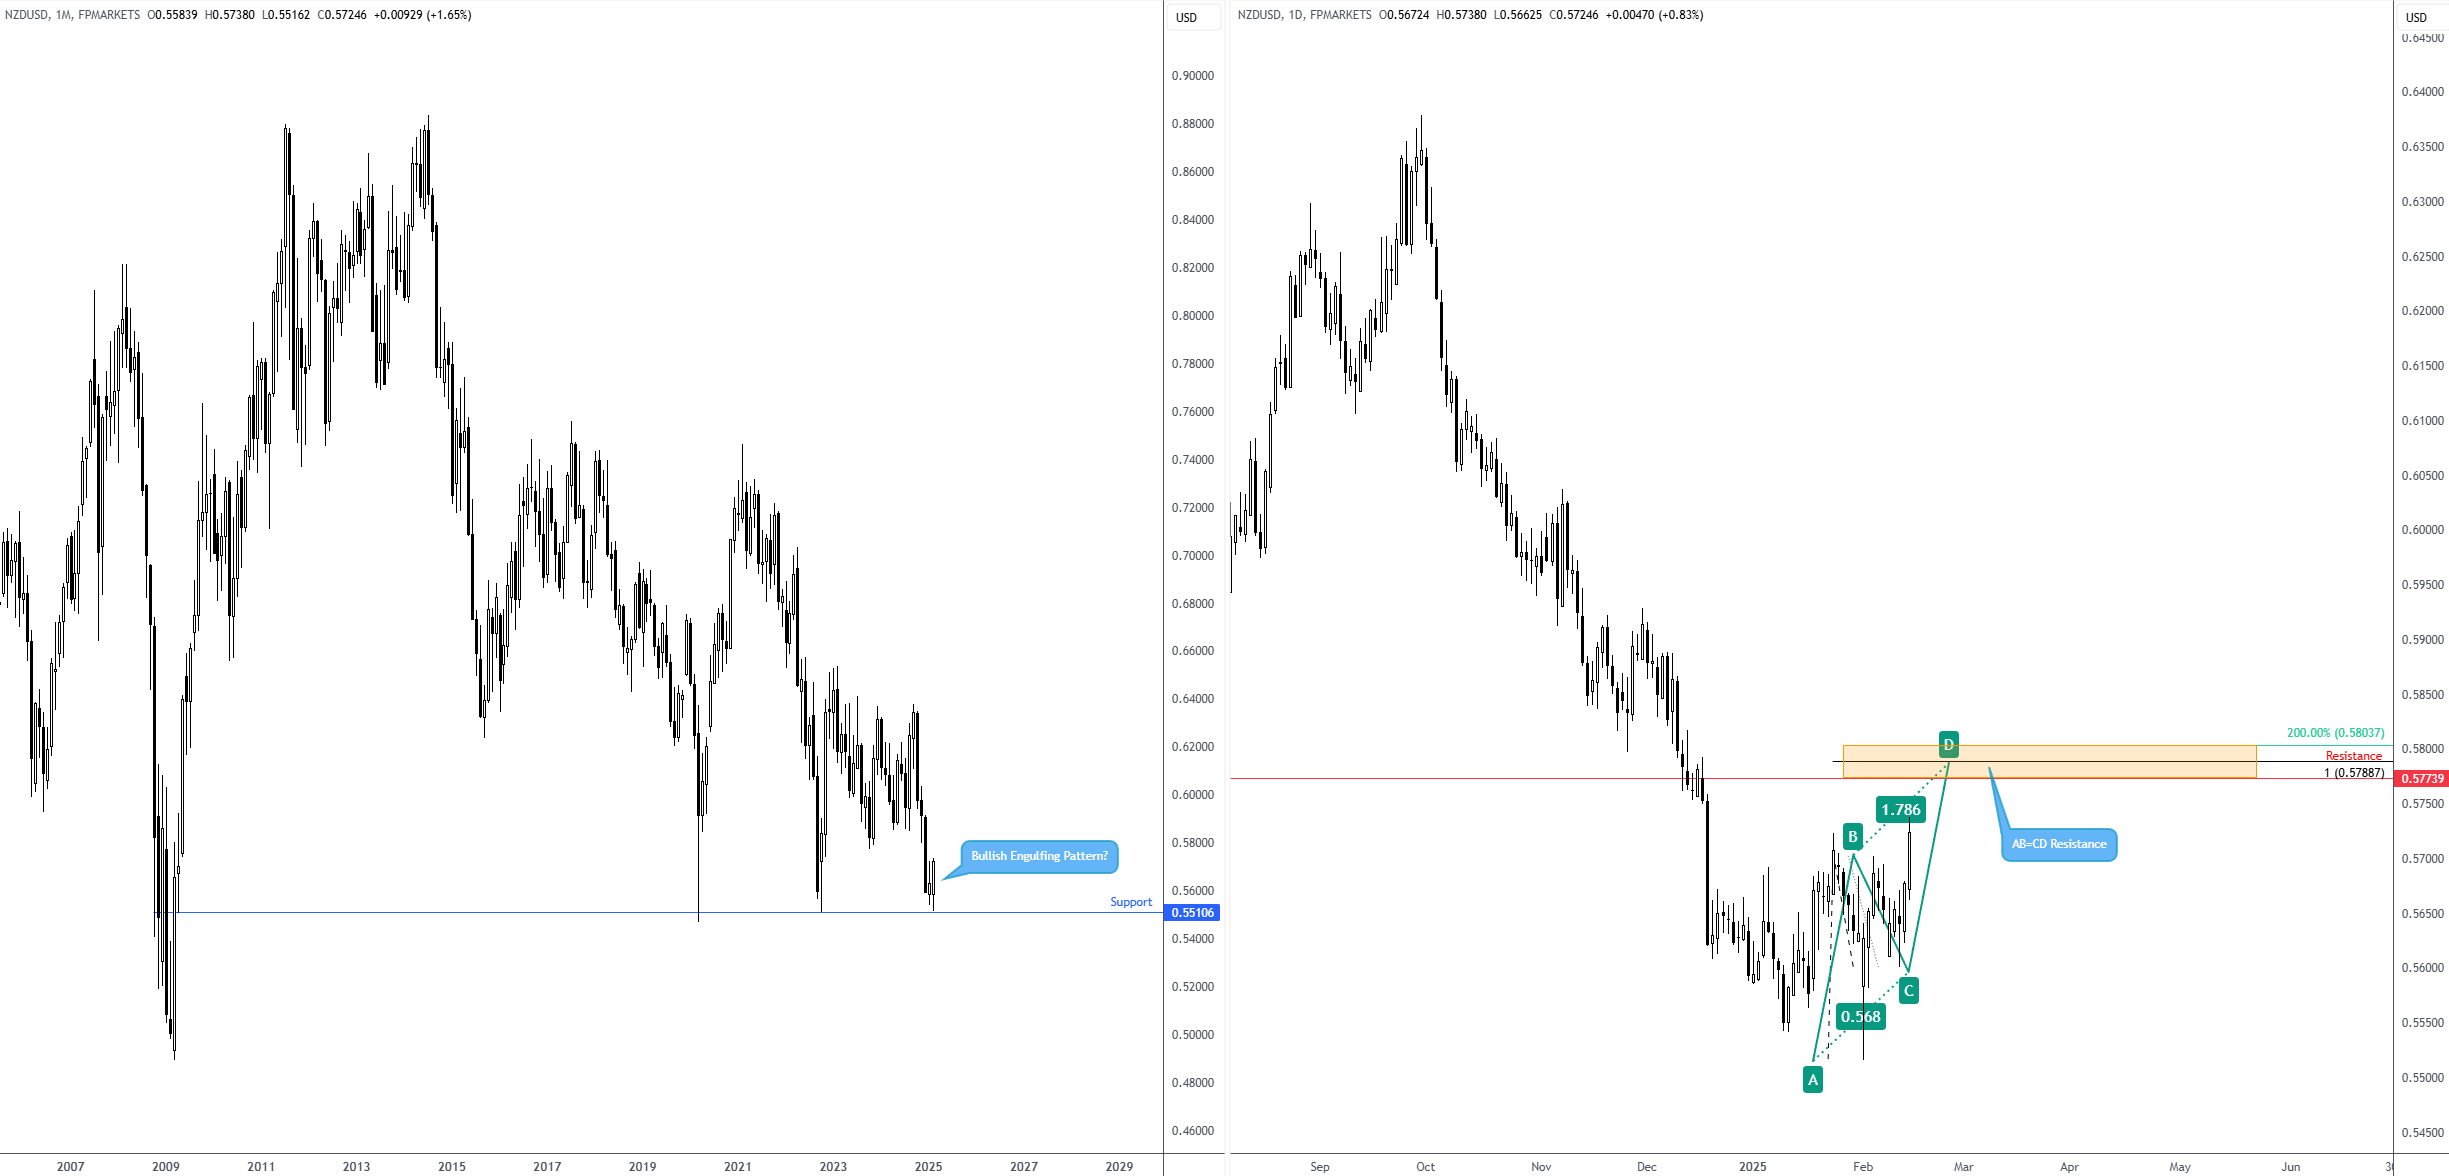
Chart created using TradingView
Author

Aaron Hill
FP Markets
After completing his Bachelor’s degree in English and Creative Writing in the UK, and subsequently spending a handful of years teaching English as a foreign language teacher around Asia, Aaron was introduced to financial trading,

















