Rates down under
S2N spotlight
Today all Australian eyes were on the Reserve Bank of Australia. Rates were cut as expected.
RBA Governor Michele Bullock said higher interest rates had been working as expected, slowing economic activity and curbing inflation, but warned that Tuesday’s first rate cut since 2020 was not the start of a series of reductions.
“Today’s decision does not imply that further rate cuts along the lines suggested by the market are coming,” she said.
“The board needs more evidence that inflation is continuing to decline before making decisions about the future path of interest rates. The board is very alert to upside risks that could derail the deflationary process.”
You know views on inflation. We are nowhere near out of the woods.
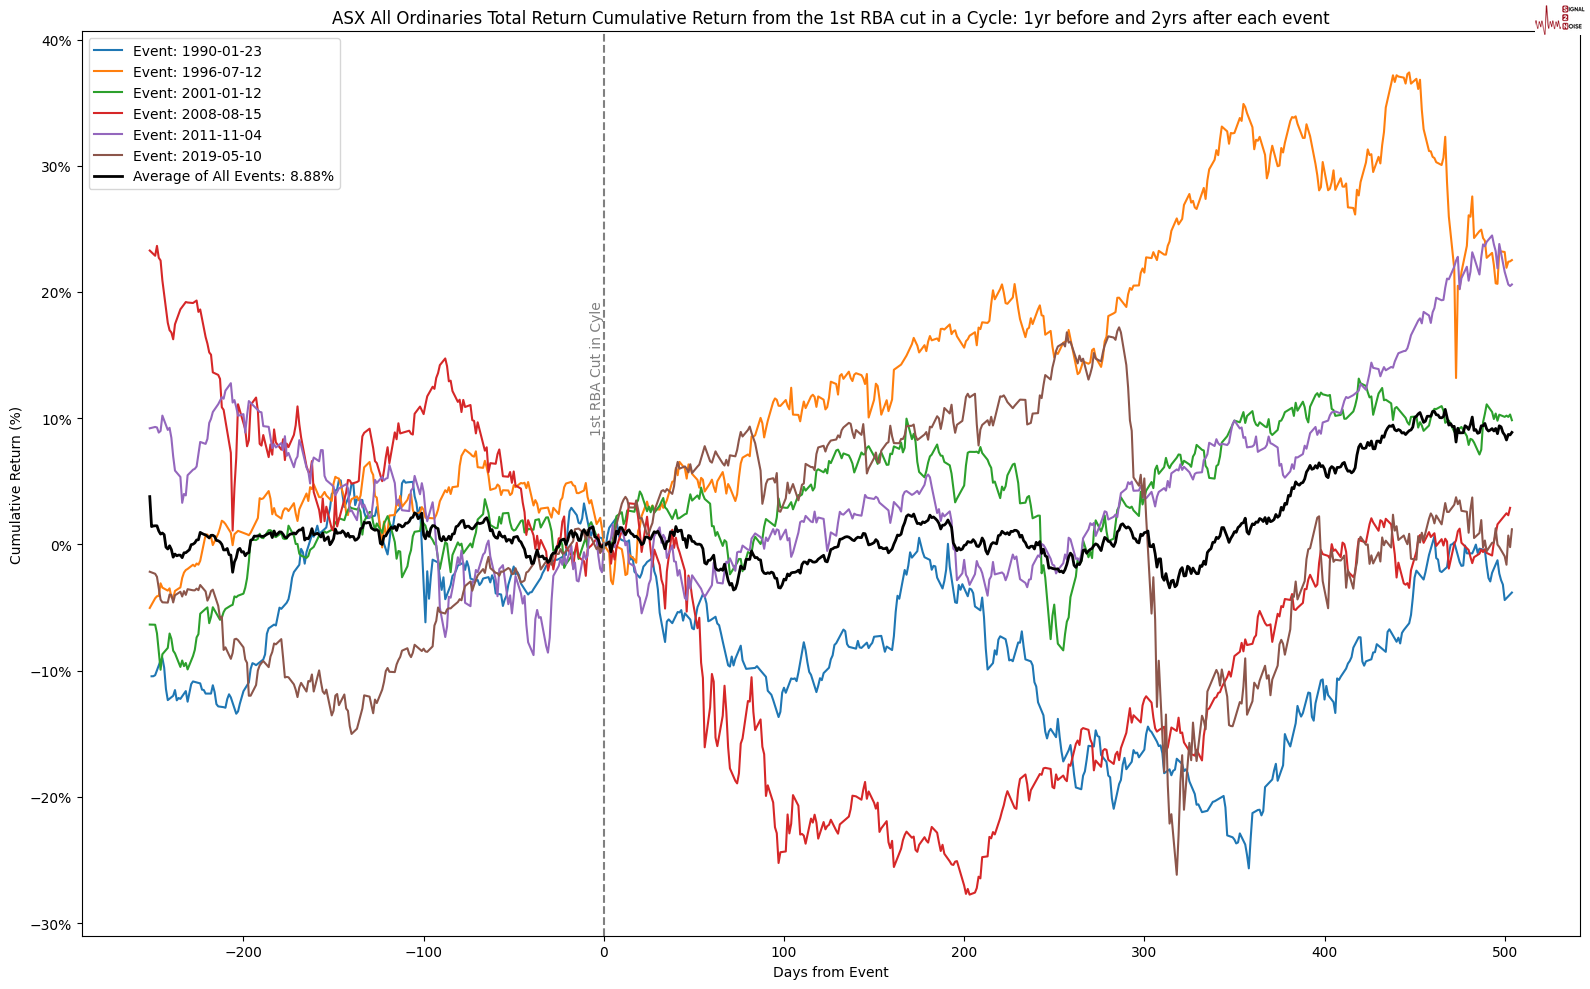
Let us look at the performance of the Australian All Ordinaries Index after the first rate cut in a cycle. Data from the RBA only goes back to 1990. I show the performance of the underlying asset a year before and 2 years after. As you can see, its a mixed bag 1 year after the cut for stocks, but over 2 years it produces an average of 9%. The point is one shouldn’t think because of a rate cut I should now buy stocks for a short to medium term trade, you need more than that to inform your decision.
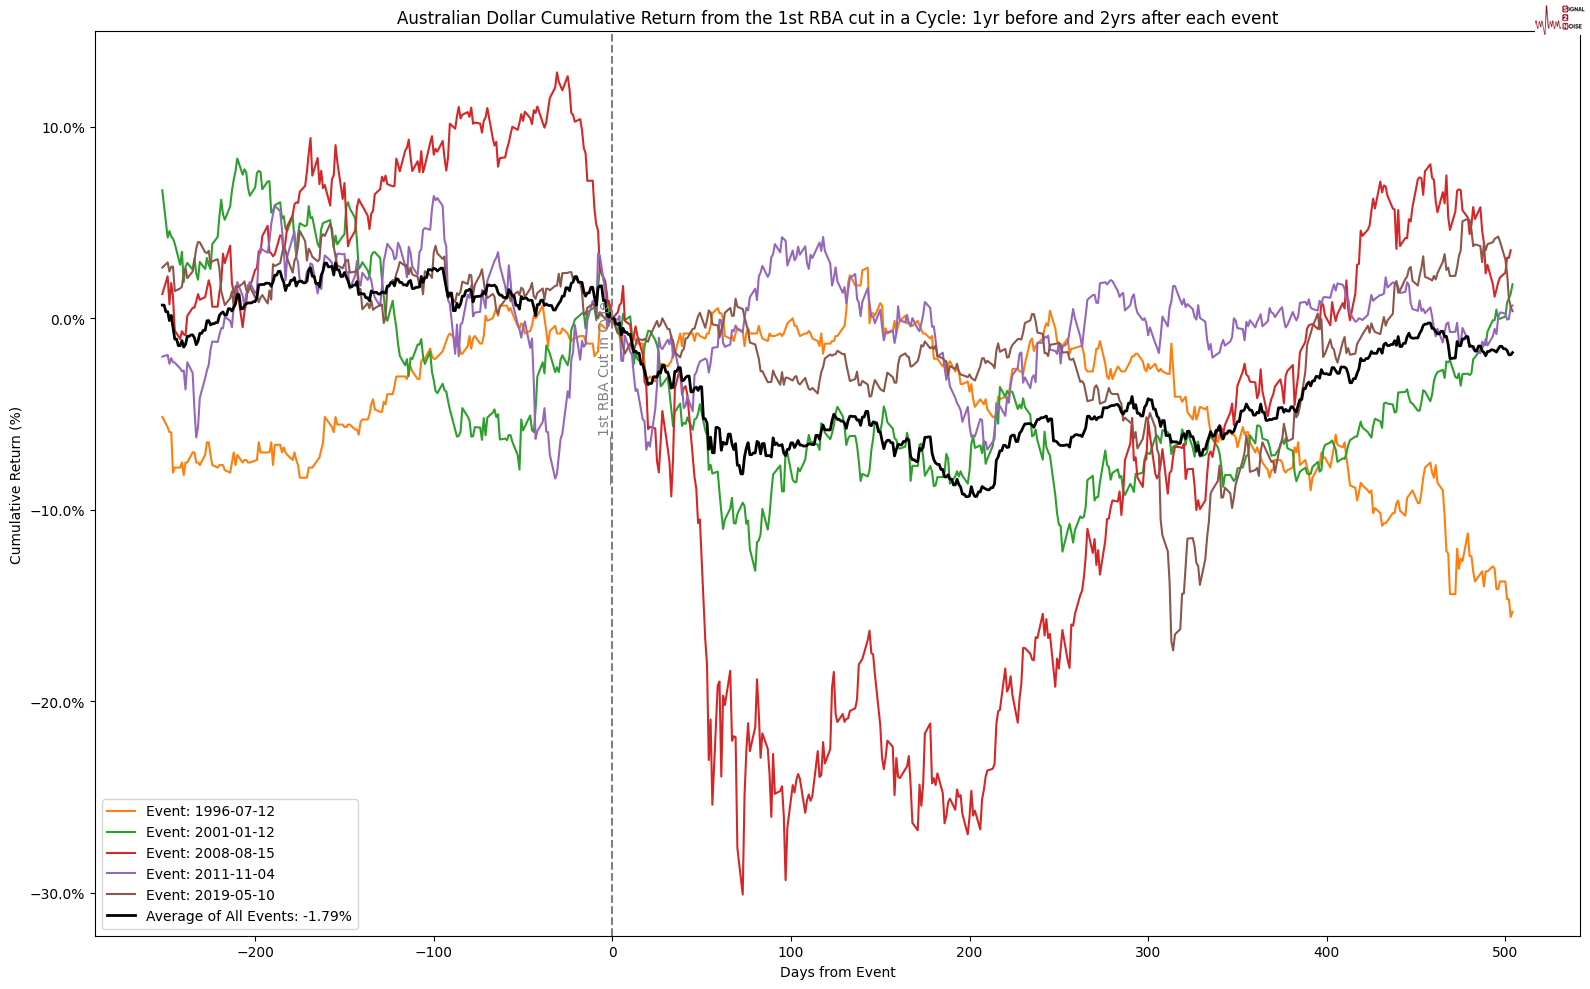
Here is a look at the Aussie Dollar as the underlying asset.
S2N observations
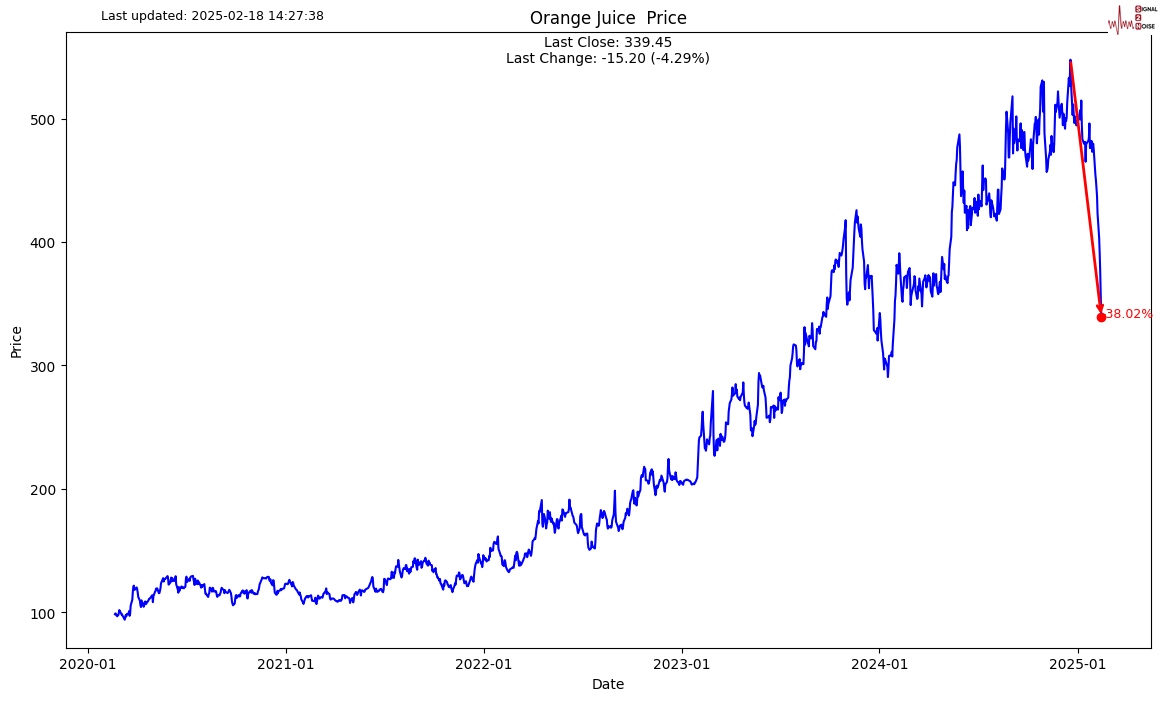
Interesting to see orange juice going down quicker than me after a run.
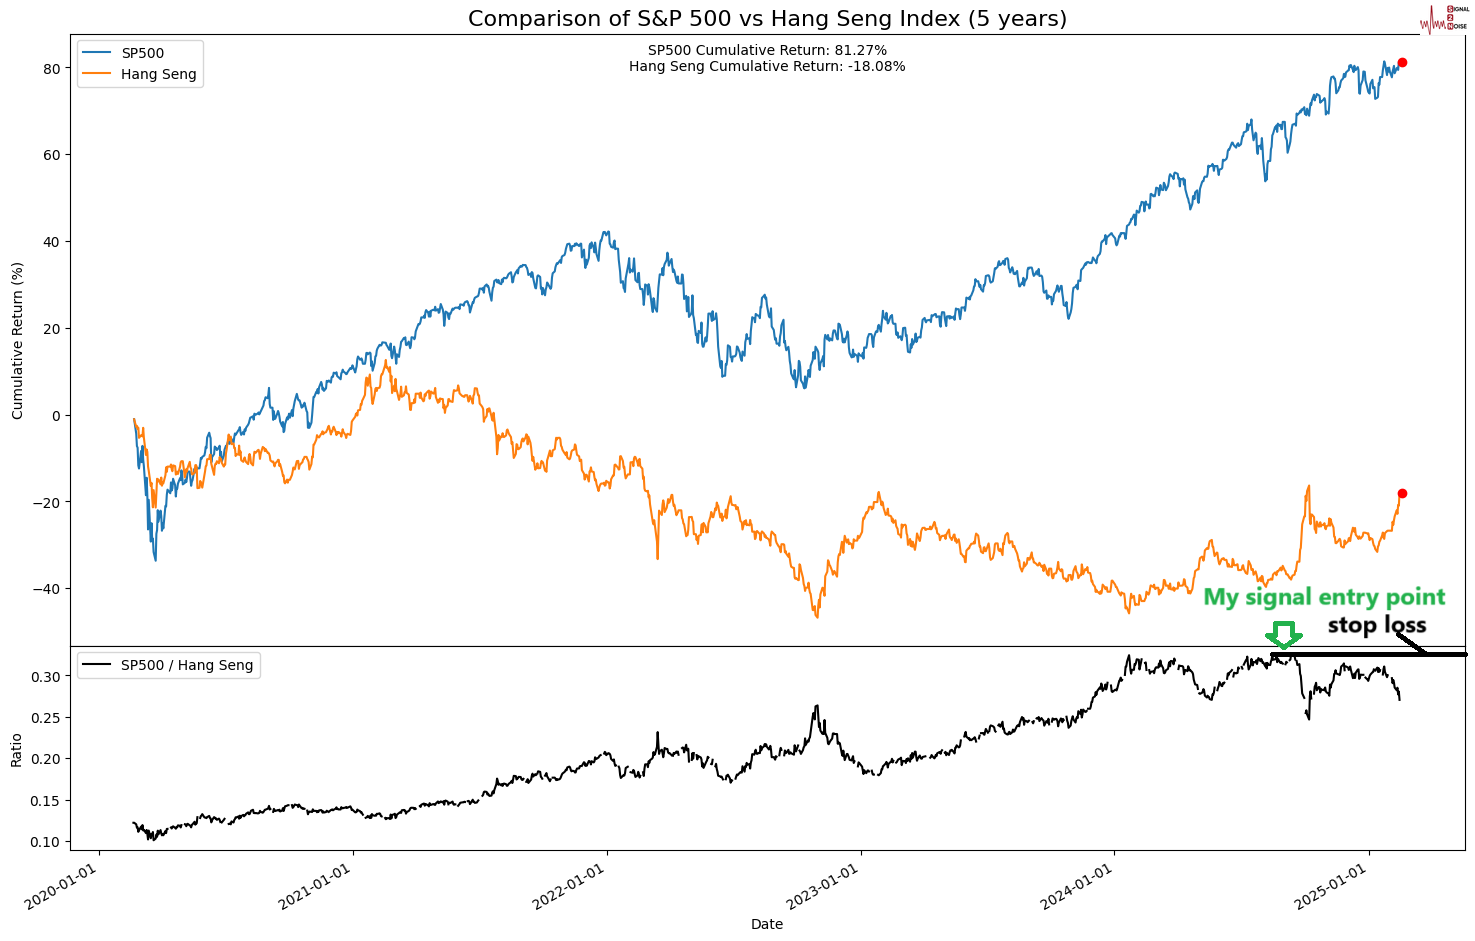
I have spoken about this contrarian trade, going long China via the Hang Seng and short the US for a number of months. As you can see on the chart from the time I suggested it we looked good at first, then nearly got stopped out. It is now starting to look good again. This is one that is hard to explain as I think things in China are not that strong economically, but are too oversold relative to the US.
A top hedge fund manager Beeneet Kothari said it best.
“The starting point on China is very different today than five years ago, 10 years ago,” he said, and “when stocks go down 90%, it’s time to start asking what can go right. That’s where you are with China.”
S2N screener alerts
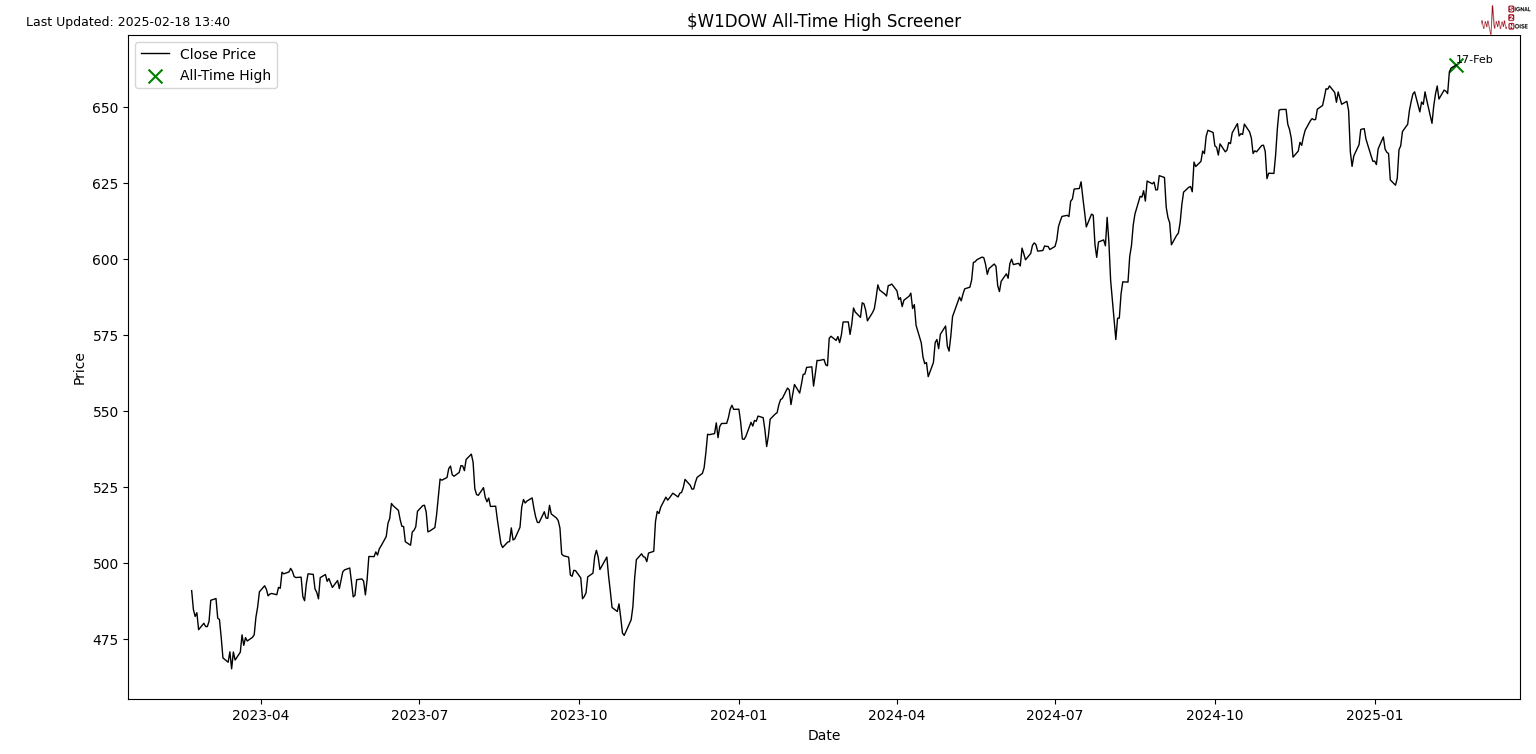
The Dow Jones Global Index made an All-Time High (ATH).
Performance review
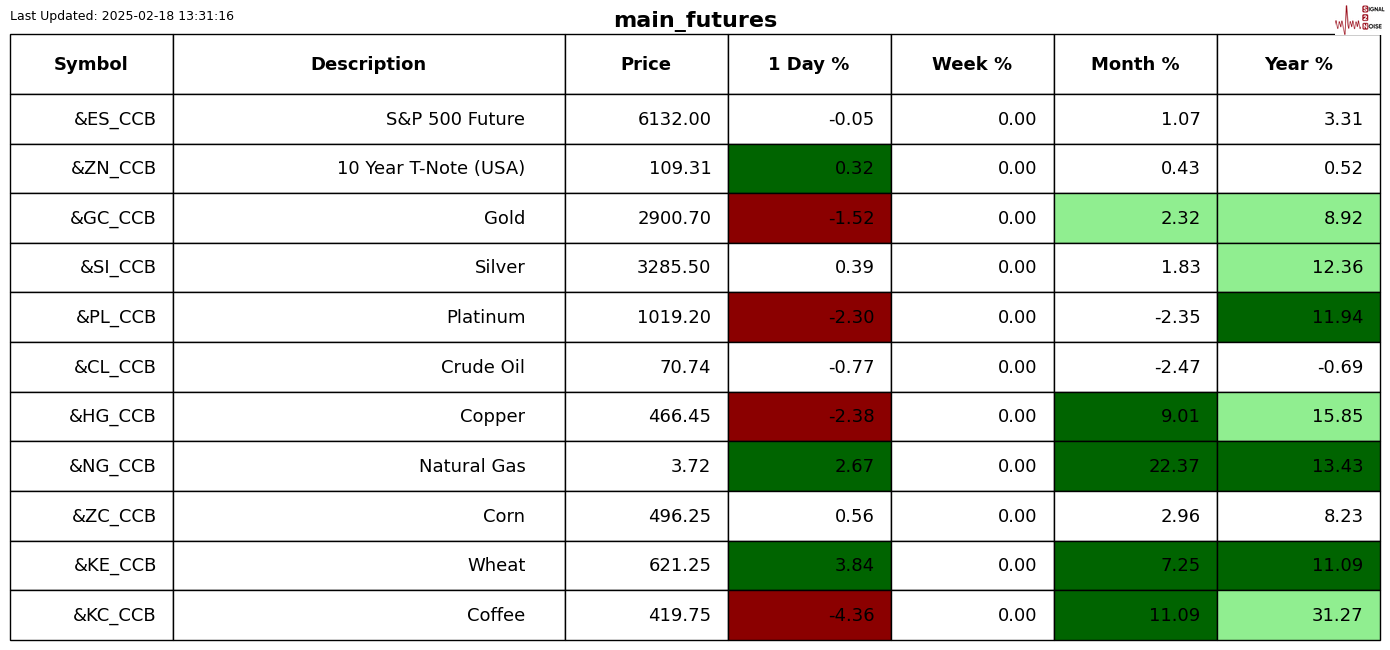
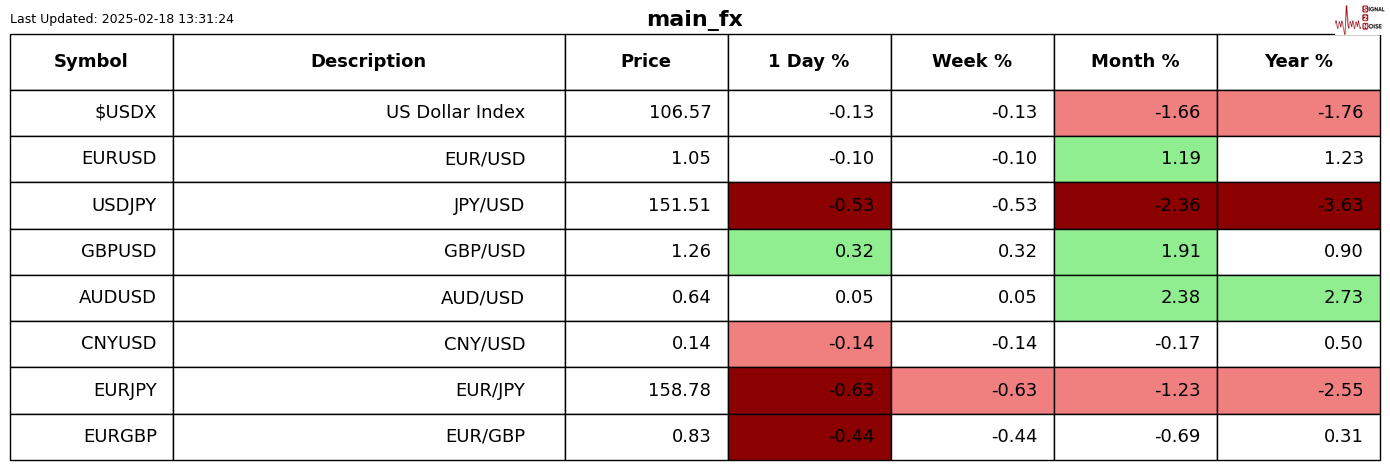
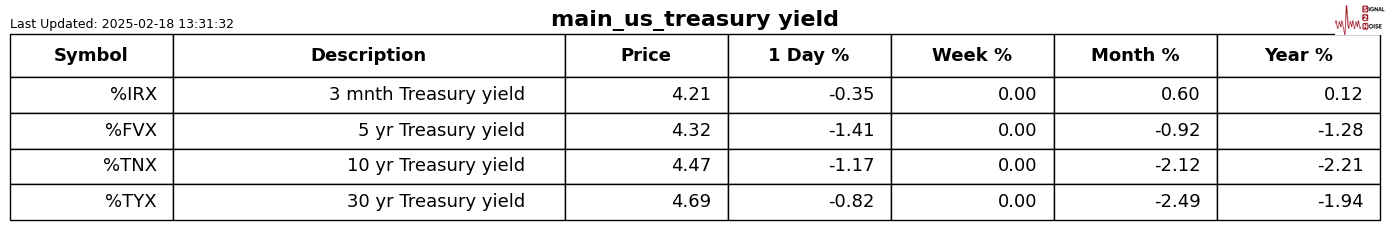
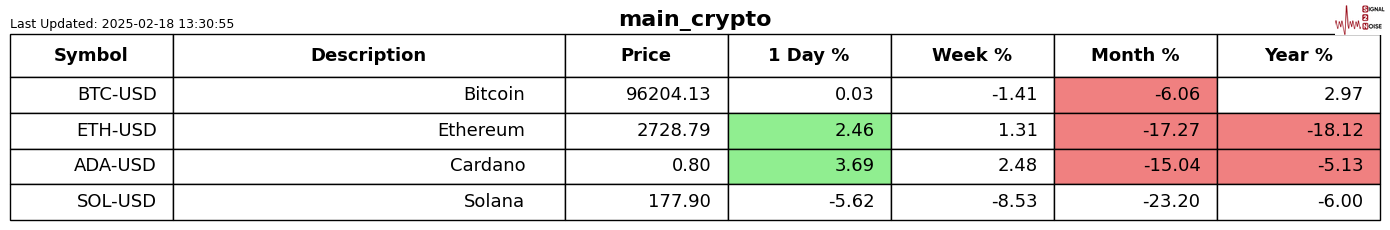
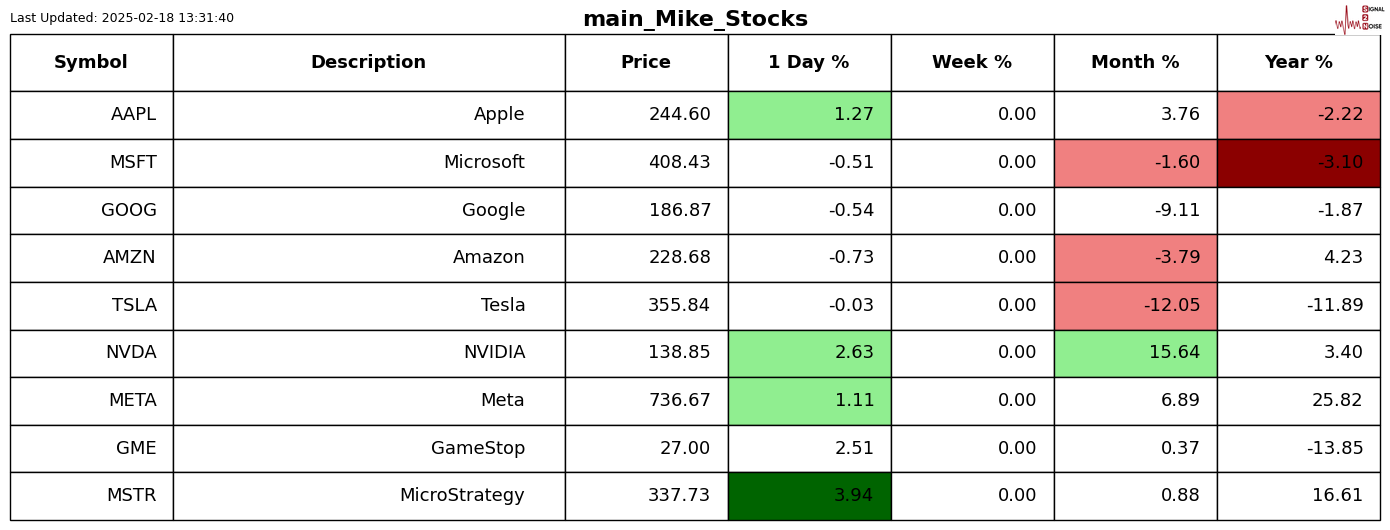
For those who are new to the letter, the shading is Z-Score adjusted so that only moves bigger than usual for the symbol are highlighted.
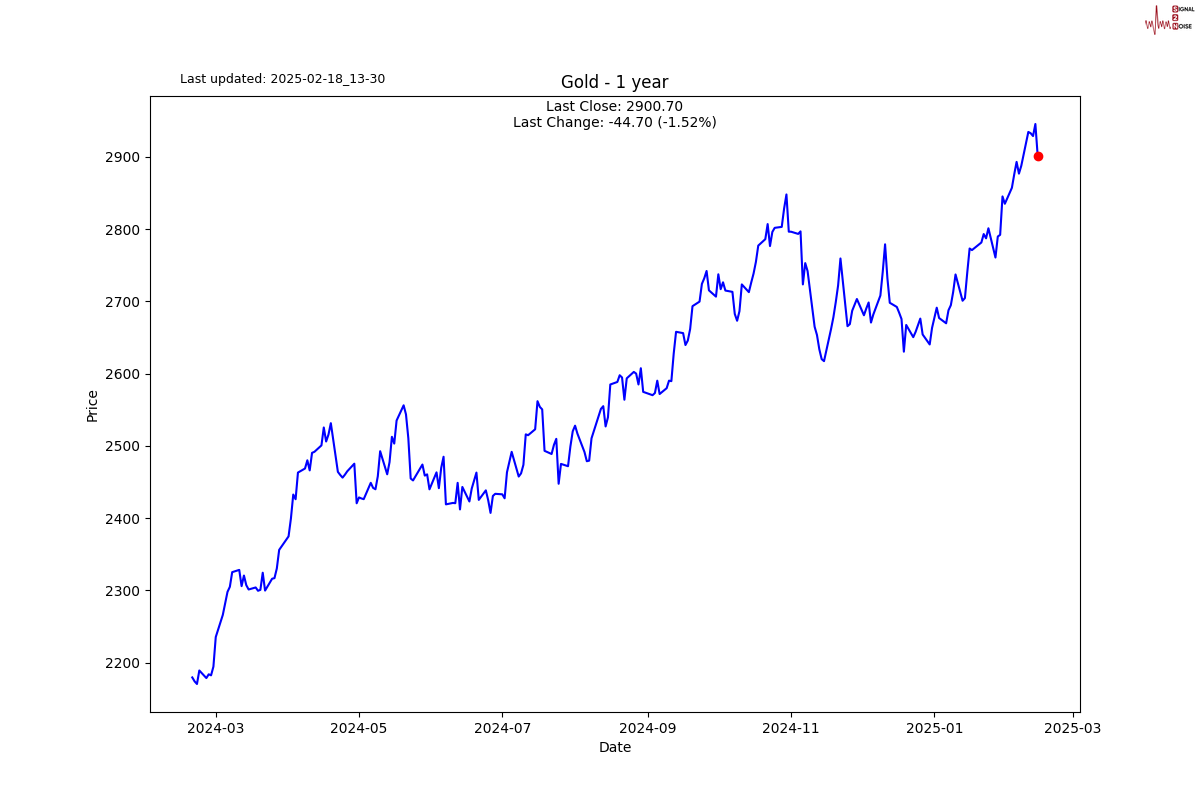
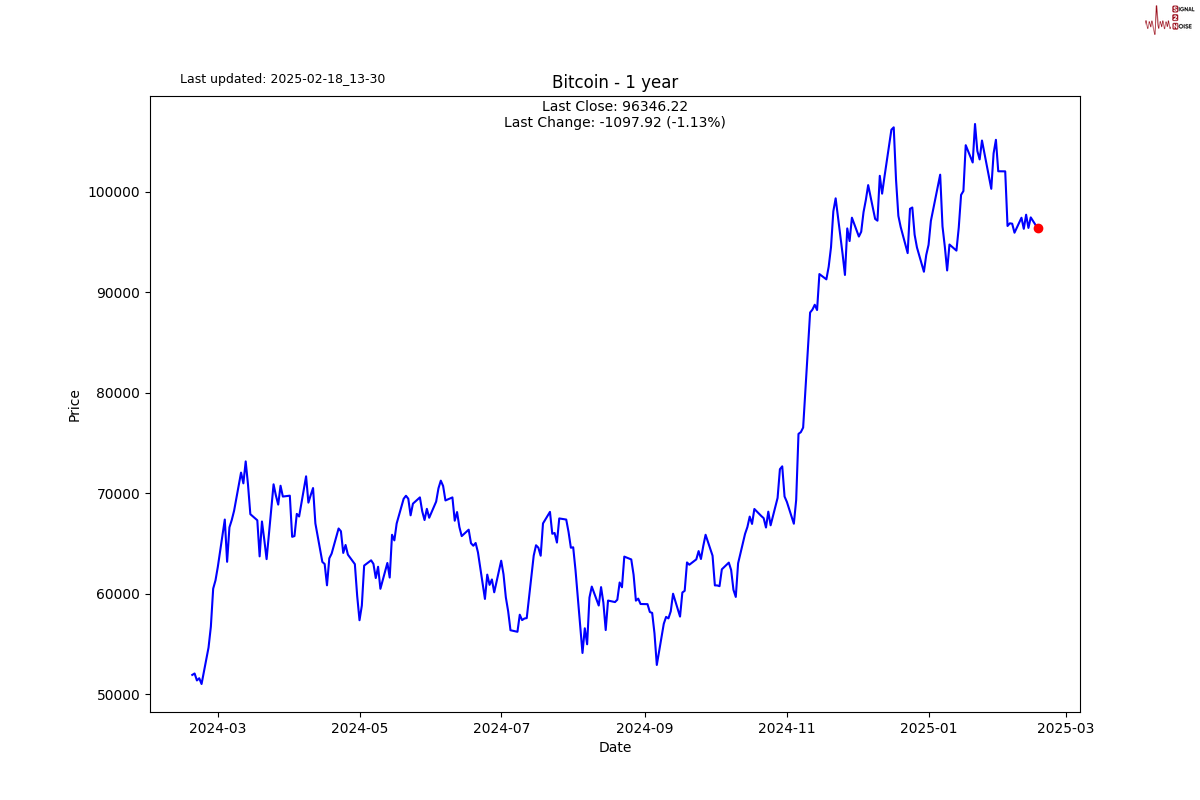
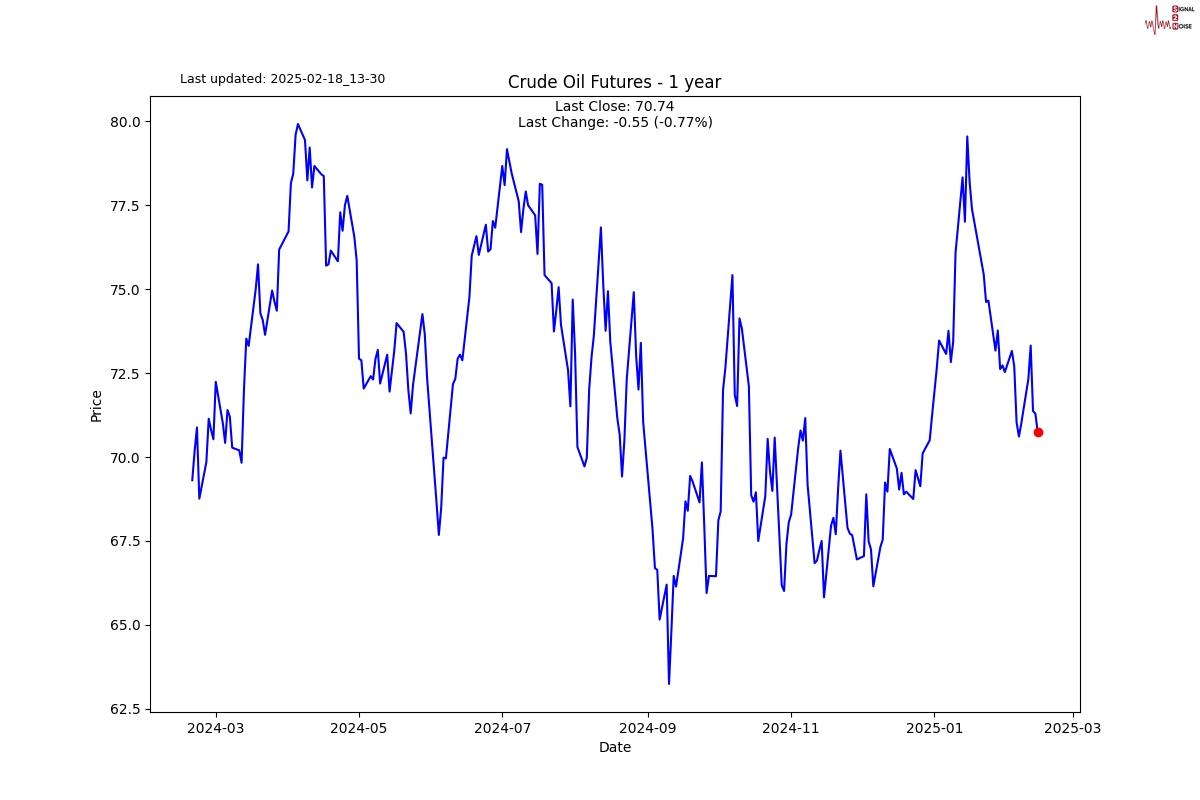
Chart gallery
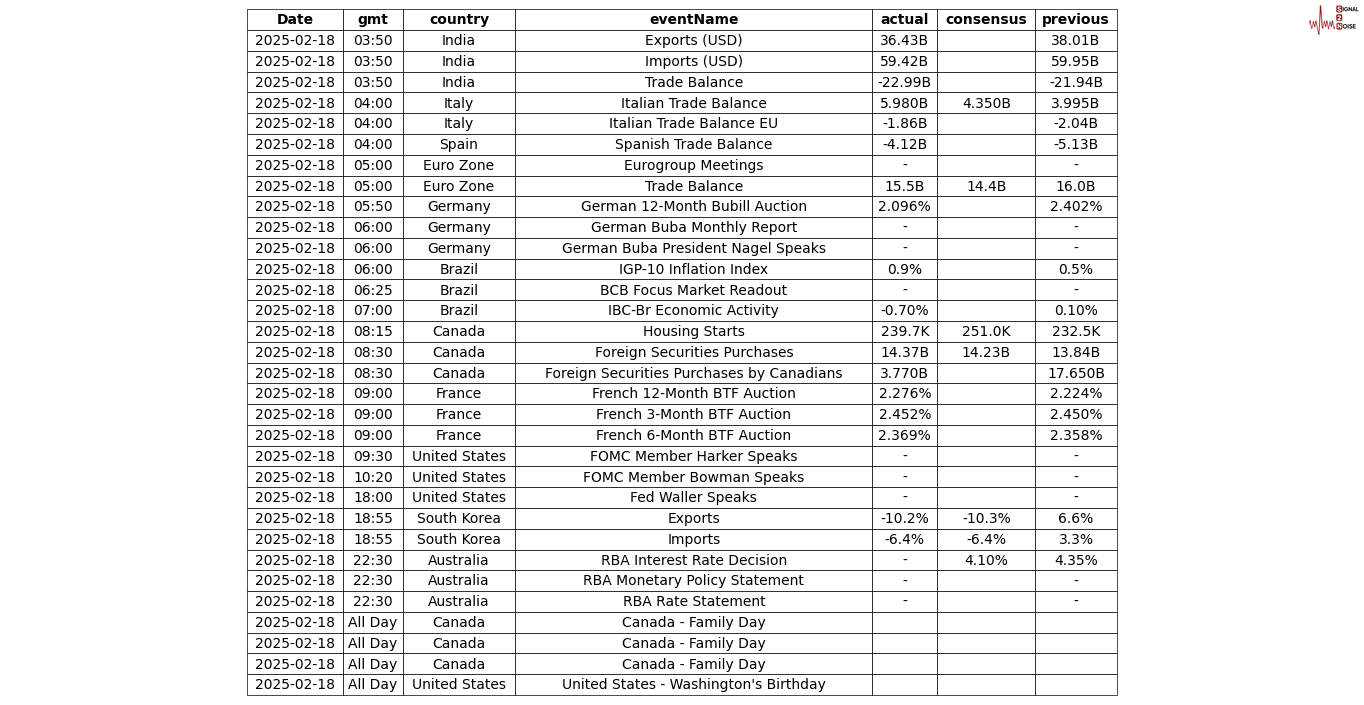
News today
Author

Michael Berman, PhD
Signal2Noise (S2N) News
Michael has decades of experience as a professional trader, hedge fund manager and incubator of emerging traders.


