Quadruple Witching [Video]
![Quadruple Witching [Video]](https://editorial.fxstreet.com/images/Markets/Commodities/Metals/Gold/aurum-37842316_XtraLarge.jpg)
US Dollar: June USD is Down at 102.300.
Energies: April'20 Crude Up at 27.96.
Financials: The June'20 30 year bond is Up 54 ticks and trading at 174.10.
Indices: The March S&P 500 emini ES contract is 392 ticks Higher and trading at 2487.00.
Gold: The April '20 Gold contract is trading Up at 1509.30. Gold is 300 ticks Higher than its close.
Initial Conclusion
This is not a correlated market. The dollar is Down- and Crude is Up+ which is normal but the 30 year Bond is trading Higher. The Financials should always correlate with the US dollar such that if the dollar is lower then bonds should follow and vice-versa. The S&P is Higher and Crude is trading Higher which is not correlated. Gold is trading Higher which is correlated with the US dollar trading Up. I tend to believe that Gold has an inverse relationship with the US Dollar as when the US Dollar is down, Gold tends to rise in value and vice-versa. Think of it as a seesaw, when one is up the other should be down. I point this out to you to make you aware that when we don't have a correlated market, it means something is wrong. As traders you need to be aware of this and proceed with your eyes wide open.
At this time all of Asia is trading Higher with the exception of the Nikkei exchange. Currently all of Europe is trading Higher.
Possible Challenges To Traders Today:
-
Existing Home Sales is out at 10 AM EST. This is Major.
-
Lack of Major economic news.
Treasuries
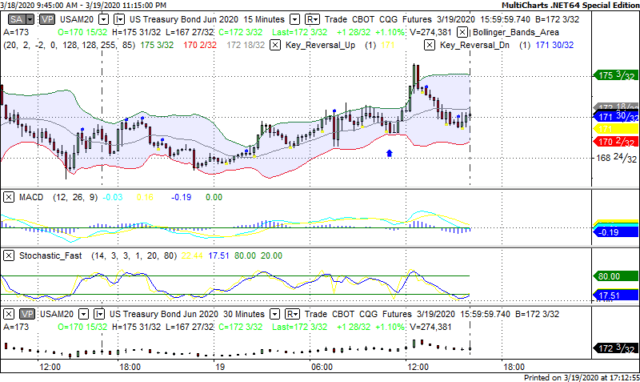
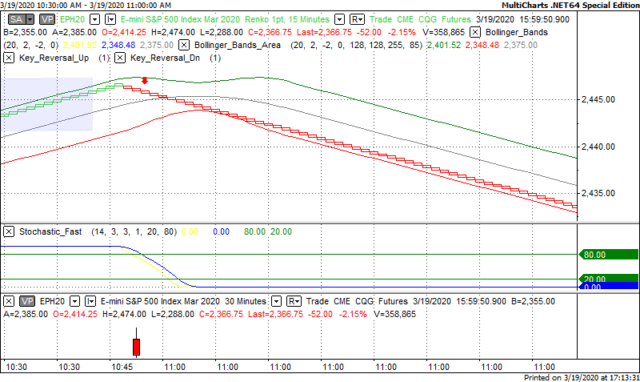
We've elected to switch gears a bit and show correlation between the 30 year bond (ZB) and The S&P futures contract. The S&P contract is the Standard and Poor's and the purpose is to show reverse correlation between the two instruments. Remember it's liken to a seesaw, when up goes up the other should go down and vice versa.
Yesterday the ZB made a move at around 11 AM EST. The ZB hit a Low at around that time and the S&P moved Lower. If you look at the charts below ZB gave a signal at around 11 AM and the S&P moved Lower at the same time. Look at the charts below and you'll see a pattern for both assets. ZB hit a Low at around 11 AM EST and the S&P was moving Lower shortly thereafter. These charts represent the newest version of MultiCharts and I've changed the timeframe to a 15 minute chart to display better. This represented a Long opportunity on the 30 year bond, as a trader you could have netted 160 plus ticks per contract on this trade. Each tick is worth $31.25. Please note: the front month for the ZB is now June '20. The S&P contract is now June '20 as well. I've changed the format to Renko bars such that it may be more apparent and visible.
Charts Courtesy of MultiCharts built on an AMP platform
Bias
Yesterday we gave the markets a Downside bias as every instrument we use for Market Correlation purposes was pointed Higher and the indices were lower in the morning. Then midday the President and the FDA chief held a news conference and the markets leapt Higher. The Dow advanced by 188 points and the other indices gained ground as well. Today we aren't dealing with a correlated market and our bias is Neutral.
Could this change? Of Course. Remember anything can happen in a volatile market.
Commentary
Yesterday morning the markets were correlated to the Downside and when the markets opened they opened to the Downside. However around Midday the President held a news conference with the head of the FDA in tow. At this conference it was revealed that the FDA will explore the prospect of using existing drugs to combat coronavirus. Understand that this is not a remedy for COVID-19 but will need to go thru further studies to determine feasibility. Now I would venture that there's some moron out there who will swear that a cure has been found but there isn't a vaccine yet and there won't be for quite some time. Be that as it may the markets did advance and to be clear as we state everyday when making a bias, this too can change as it did yesterday.
Author

Nick Mastrandrea
Market Tea Leaves


