Quadruple Witching

US Dollar: Mar. USD is Down at 93.025.
Energies: Jan ’18 Crude is Up at 57.40.
Financials: The Mar 30 year bond is Down 1 tick and trading at 154.02.
Indices: The Dec S&P 500 emini ES contract is 16 ticks Higher and trading at 2660.00.
Gold: The Feb gold contract is trading Up at 1259.60. Gold is 25 ticks Higher than its close.
Initial Conclusion
This is not a correlated market. The dollar is Down- and Crude is Up+ which is normal and the 30 year Bond is trading Lower. The Financials should always correlate with the US dollar such that if the dollar is lower then bonds should follow and vice-versa. The indices are Higher and Crude is trading Up+ which is not correlated. Gold is trading Up+ which is correlated with the US dollar trading Down-. I tend to believe that Gold has an inverse relationship with the US Dollar as when the US Dollar is down, Gold tends to rise in value and vice-versa. Think of it as a seesaw, when one is up the other should be down. I point this out to you to make you aware that when we don’t have a correlated market, it means something is wrong. As traders you need to be aware of this and proceed with your eyes wide open.
At this hour all of Asia is trading Lower with the exception of the Indian Sensex exchange which is trading Higher. As of this writing Europe is trading mainly Lower with the exception of the Spanish IBEX exchange which is trading fractionally Higher.
Possible Challenges To Traders Today
-
Empire State Mfg Index is out at 8:30 AM EST. This is major.
-
Capacity Utilization Rate is out at 9:15 AM EST. This is major.
-
Industrial Production m/m is out at 9:15 AM EST. Major
-
TIC Long-Term Purchases is out at 4 PM EST. This is major.
Treasuries
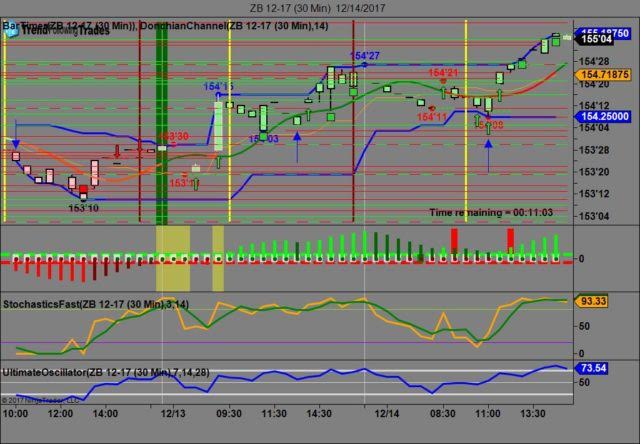
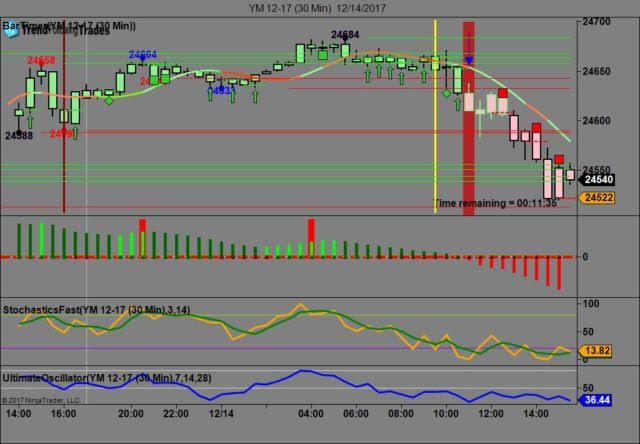
We’ve elected to switch gears a bit and show correlation between the 30 year bond (ZB) and The YM futures contract. The YM contract is the DJIA and the purpose is to show reverse correlation between the two instruments. Remember it’s liken to a seesaw, when up goes up the other should go down and vice versa.
Yesterday the ZB made it’s move at around 11 AM EST. The ZB hit a Low at around that time and the YM hit a High. If you look at the charts below ZB gave a signal at around 11 AM EST and the YM was moving Lower at the same time. Look at the charts below and you’ll see a pattern for both assets. ZB hit a Low at around 11 AM and the YM hit a High. These charts represent the newest version of Trend Following Trades and I’ve changed the timeframe to a 30 minute chart to display better. This represented a shorting opportunity on the 30 year bond, as a trader you could have netted about 20 plus ticks per contract on this trade. Each tick is worth $31.25. We added a Donchian Channel to the charts to show the signals more clearly.
Charts Courtesy of Trend Following Trades built on a NinjaTrader platform.
Bias
Yesterday we gave the markets an Upside bias as the USD and the Bonds were both trading down and this usually represents an upside day. The markets however had other ideas as the Dow dropped 77 points and the other indices lost ground as well. Given that today is Quadruple Witching Friday our bias is neutral.
Could this change? Of Course. Remember anything can happen in a volatile market.
Commentary
Today we have Quadruple Witching Friday to deal with. This happens 4 times a year and represents the expiration and rollover of stock index futures, stock index options, stock options and single stock futures. This usually results in high volume and volatility. Yesterday’s action was only to be expected as sooner or later the markets will come down to earth. Remember what goes up will surely come down sooner or later. The Dow snapped a 5 day winning streak.
Author

Nick Mastrandrea
Market Tea Leaves


