Q3 over, Q4 begins

USD: Sep '23 is Up at 106.175.
Energies: Nov '23 Crude is Up at 91.65.
Financials: The Dec '23 30 Year T-Bond is Down 17 ticks and trading at 113.08.
Indices: The Dec '23 S&P 500 emini ES contract is 10 ticks Higher and trading at 4328.00.
Gold: The Dec'23 Gold contract is trading Down at 1850.90.
Initial conclusion
This is not a correlated market. The USD is Up and Crude is Up which is not normal, but the 30 Year T-Bond is trading Lower. The Financials should always correlate with the US dollar such that if the dollar is Higher, then the bonds should follow and vice-versa. The S&P is Higher, and Crude is trading Higher which is not correlated. Gold is trading Lower which is correlated with the US dollar trading Up. I tend to believe that Gold has an inverse relationship with the US Dollar as when the US Dollar is down, Gold tends to rise in value and vice-versa. Think of it as a seesaw, when one is up the other should be down. I point this out to you to make you aware that when we don't have a correlated market, it means something is wrong. As traders you need to be aware of this and proceed with your eyes wide open. Asia is trading Mixed with half the exchanges Lower and the other half Higher. All of Europe is trading Lower with the exception of the Spanish IBEX exchange which is Down fractionally.
Possible challenges to traders
-
Final Manufacturing PMI is out at 9:45 AM EST. This is Major.
-
ISM Manufacturing PMI is out at 10 AM EST. This is Major.
-
ISM Manufacturing Prices is out at 10 AM EST. This is Major.
-
Construction Spending is out at 10 AM EST. This is Major.
-
Fed Chair Powell Speaks at 11 AM EST. This is Major.
-
FOMC Member Harker Speaks at 11 AM EST. This is Major.
-
FOMC Member Barr Speaks at 1 PM EST. This is Major.
Treasuries
Traders, please note that we've changed the Bond instrument from the 30 year (ZB) to the 10 year (ZN). They work exactly the same.
We've elected to switch gears a bit and show correlation between the 10-year bond (ZN) and the S&P futures contract. The S&P contract is the Standard and Poor's, and the purpose is to show reverse correlation between the two instruments. Remember it's likened to a seesaw, when up goes up the other should go down and vice versa.
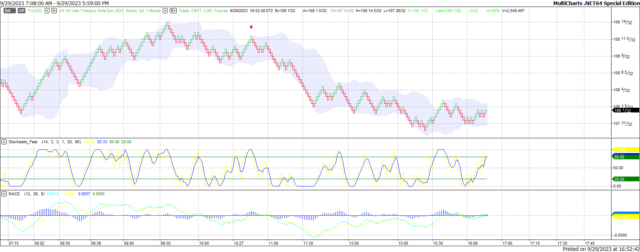
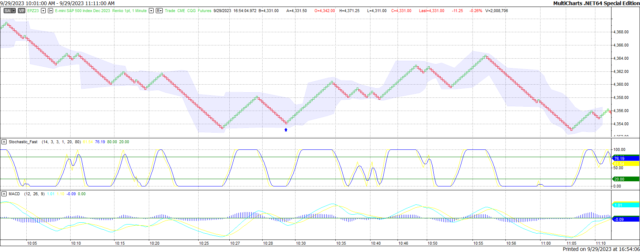
On Friday the ZN migrated Lower at around 10:30 AM EST as the S&P hit a Low at around the same time. If you look at the charts below the S&P gave a signal at around 10:30 AM and the ZN started its Downward slide. Look at the charts below and you'll see a pattern for both assets. S&P hit a High at around 9:50 AM and migrated Lower. These charts represent the newest version of MultiCharts and I've changed the timeframe to a 15-minute chart to display better. This represented a Shortortunity on the 10-year note, as a trader you could have netted about 20 ticks per contract on this trade. Each tick is worth $15.625. Please note: the front month for the ZN is now Dec '23. The S&P contract is now Dec' 23. I've changed the format to filled Candlesticks (not hollow) such that it may be more apparent and visible.
Charts courtesy of MultiCharts built on an AMP platform
ZN - Dec 2023 - 9/29/23
S&P - Dec 2023 - 9/29/23
Bias
On Friday, we gave the markets an Upside bias as the USD was trading Lower Friday morning and that usually represents an Upside Day. The markets however had other ideas as the Dow closed Lower by 148 points, the other indices did manage to close Higher. Today we aren't dealing with a correlated market and our bias is Neutral or Mixed.
Could this change? Of Course. Remember anything can happen in a volatile market.
Commentary
Friday marked the end of the 3rd calendar quarter, 2023 and whereas July showed good growth potential; that all changed in August. In July the Dow grew to an average of 35,757, that number showed a decline in August to 34,130. It rose again in September only to falter once more and in fact is showing a Lower Low as time goes on. So, what's happening? Usually in September after Labor Day the markets generally pick up steam and show some growth. That didn't happen this year. There are a number of factors that come into play this year that make it different:
- Interest Rates - The Federal Reserve is so intent on stopping inflation that they continually raise rates in an attempt to slow down the economy and thus slow down inflation. The only problem with this is that they can drive this economy into a ditch if they aren't careful. Mortgage interest rates have risen to about 8 percent, and it hasn't been that high in over 20 years.
- Border Issues - The population in the United States has risen by over 2 million since this administration has taken office and this isn't because of increased births. The US is virtually allowing anyone to come into this country without being vetted and we have no idea who these people are, what if any convictions they had in their native countries. Sanctuary states and cities are spending billions to house, clothe, feed and in some cases provide cell phones to these people and the same cities are demanding work permits for these people and they can't speak our native language. This is a drain on our resources and means that there will be less money spent on our own people.
- Looming Government Shutdown - This problem has been averted due to a stop gap measure approved by the Senate and President. However, it is only for 45 days and will need to be revisited as it is temporary at best.
Bottom line, I am hopeful that the 4th calendar quarter will be better than the 3rd has been, but as in all things only time will tell.
Author

Nick Mastrandrea
Market Tea Leaves


