Probing Gold’s bottom

As 2020 is wrapping up, investors are trying to narrow down the target for gold’s bottom in the coming weeks. And as the yellow metal is experiencing what appears to be its worst month in the past four years, the Gold Miners Bullish Percent Index ($BPGDM) once again provides us with some key insights into reading the bearish signals for the precious metals.
Last week, the BPGDM showed the highest possible overbought reading.
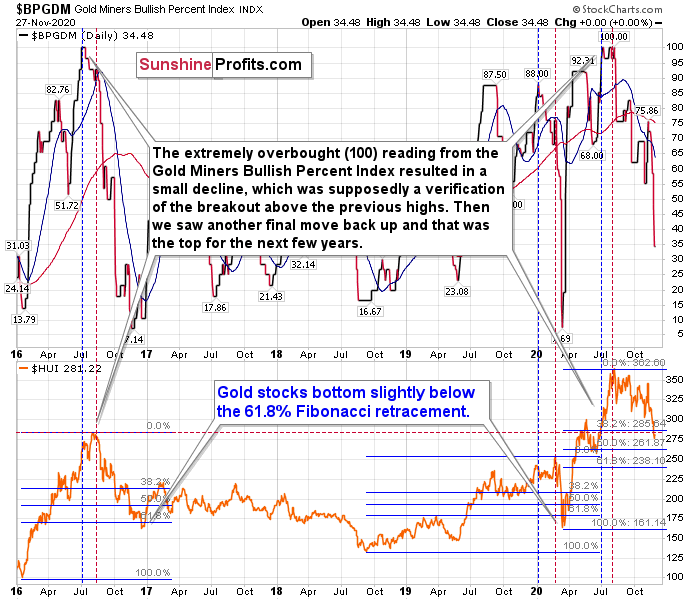
The excessive bullishness was present at the 2016 top as well and it didn’t cause the situation to be any less bearish in reality. All markets periodically get ahead of themselves regardless of how bullish the long-term outlook really is. Then, they correct. If the upswing was significant, the correction is also quite often significant.
Please note that back in 2016, there was an additional quick upswing before the slide and this additional upswing had caused the $BPGDM to move up once again for a few days. It then declined once again. We saw something similar also in the middle of this year. In this case, the move up took the index once again to the 100 level, while in 2016 this wasn’t the case. But still, the similarity remains present.
Back in 2016, when we saw this phenomenon, it was already after the top, and right before the big decline.
Based on the decline from above 350 to below 280, we know that a significant decline is definitely taking place. But has it already run its course?
Let’s consider two similar cases when gold miners declined significantly after the $BPGDM was very high: the 2016 decline and early-2020 decline.
In both cases, the HUI Index continued to decline until it moved slightly below its 61.8% Fibonacci retracement level. This means that if the history is to repeat itself, we shouldn’t expect any major turnaround until the gold miners decline to 220 - 230 or so. Depending on how things are developing in gold, the above might or might not be the final bottom, though.
Please note that the HUI already declined below its 2016 high. This breakdown is yet another bearish sign.
Please note that back in 2016 (after the top), and in March 2020, the buying opportunity didn’t present itself until the $BPGDM was below 10. Currently, it’s above 30, so it seems that miners are likely to move even lower.
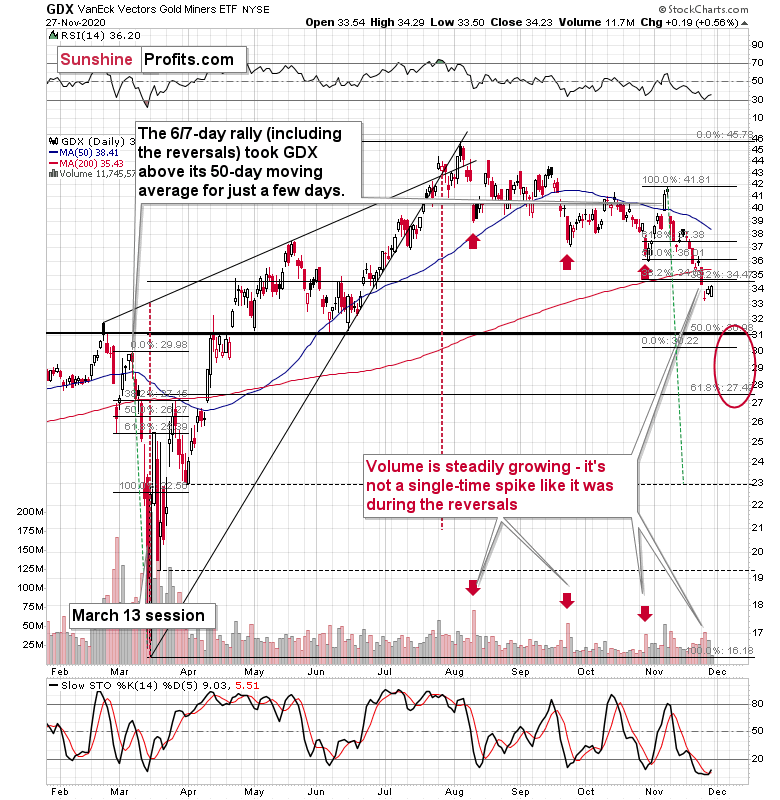
Two week s ago, when I was preparing the analysis of the above GDX ETF chart, I commented on the late-week rebound in the following way:
On Thursday (Nov 12 th ) and Friday (Nov 13 th ) of last week, miners moved and closed higher, but it’s important to note that their upswing was tiny and not accompanied by strong volume. In other words, it has all the characteristics of the breather that’s going to be followed by another move in the direction in which the market had been moving previously.
The previous move was down, so the implications are bearish.
Something similar took place during last week as well as the previous week, and thus today’s comments will be similar. It seems that we now have this specific weekly gold stocks seasonality where miners decline strongly early in the week and then show some limited strength before the weekend.
For now, it seems that we have just likely seen a regular breather that is likely to be followed by further declines.
As indicated earlier, the biggest part of the decline might start shortly after Thanksgiving .
Also, let’s not forget that the GDX ETF has recently invalidated the breakout above the 61.8% Fibonacci retracement based on the 2011 – 2016 decline.
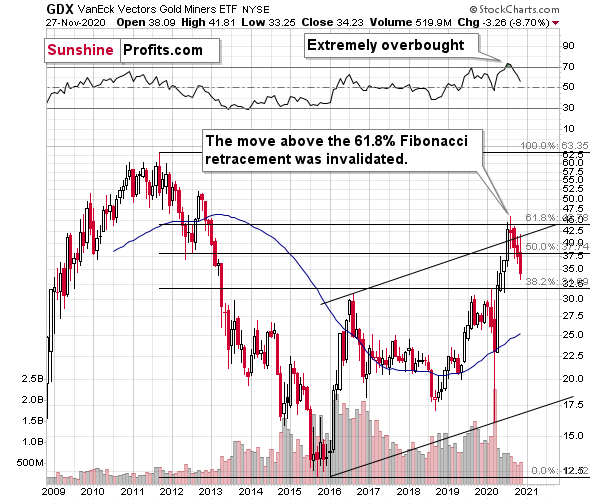
When GDX approached its 38.2% Fibonacci retracement, it declined sharply – it was right after the 2016 top. Are we seeing the 2020 top right now? This is quite possible – PMs are likely to decline after the sharp upswing, and since there is just more than one month left before the year ends, it might be the case that they move north of the recent highs only in 2021.
Either way, miners’ inability to move above the 61.8% Fibonacci retracement level and their invalidation of the tiny breakout is a bearish sign.
The same goes for miners’ inability to stay above the rising support line – the line that’s parallel to the line based on the 2016 and 2020 lows.
Thank you for reading our free analysis today. Please note that the following is just a small fraction of today’s all-encompassing Gold & Silver Trading Alert. The latter includes multiple premium details such as the downside target for gold that could be reached in the next few weeks.
Want free follow-ups to the above article and details not available to 99%+ investors? Sign up to our free newsletter today!
Want free follow-ups to the above article and details not available to 99%+ investors? Sign up to our free newsletter today!
Author

Przemyslaw Radomski, CFA
Sunshine Profits
Przemyslaw Radomski, CFA (PR) is a precious metals investor and analyst who takes advantage of the emotionality on the markets, and invites you to do the same. His company, Sunshine Profits, publishes analytical software that any


