Probably Just an Upward Correction, but...
Earnings season is in full swing. We will see earnings releases from Microsoft, Amazon, Intel today. Stocks sold off on Tuesday, but yesterday's trading session was pretty neutral. Is this a short-term bottoming pattern or just quick flat correction before another leg down? We may see some more uncertainty ahead of earnings releases and investors will continue to react to bonds yield changes. There are still two possible medium-term scenarios.
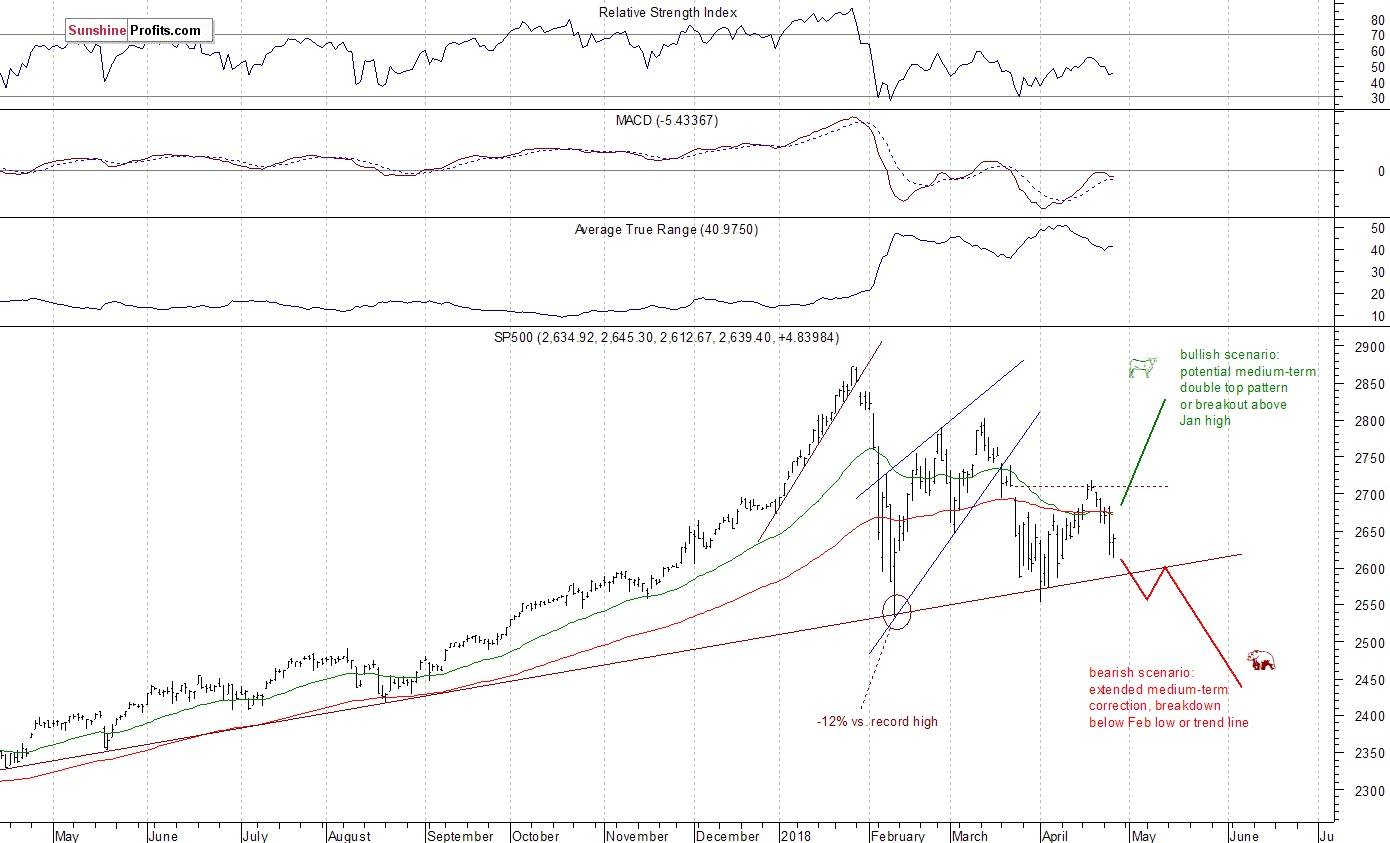
The main U.S. stock market indexes were mixed between -0.1% and +0.3% on Wednesday, as investors hesitated following Tuesday's move down. The broad stock market traded along Wednesday's closing prices. The S&P 500 index is currently 8.1% below its January 26 record high of 2,872.87. The Dow Jones Industrial Average gained 0.3% and the technology Nasdaq Composite lost 0.1% yesterday.
The nearest important level of resistance of the S&P 500 index remains at 2,645-2,655, marked by recent fluctuations. The next resistance level is at 2,680-2,700, among others. On the other hand, support level is at 2,615-2,620, marked by local lows. The next level of support is at 2,590-2,600, marked by upward trend line. The support level is also at 2,530-2,550, marked by previous local lows.
The broad stock market got closer to its medium-term upward trend line again. Stocks bounced off this line in the early April. Will they bounce again? If the index breaks lower, it could quickly continue towards the February 9 low of 2,532.69. However, stocks remain within their over two-month-long consolidation following early February sell-off. Is this a bottoming pattern before another leg higher within the long-term bull market? Or just pause before another wave of selling? So, there are still two possible future scenarios - bearish that will lead us below February low following trend line breakdown, and the bullish one in a form of medium-term double top pattern or breakout towards 3,000 mark. Stocks bounced off the resistance level in the middle of last week, and they accelerated lower on Tuesday:
Bottoming Pattern or Just Flat Correction?
The index futures contracts trade between +0.2% and +0.5% vs. their yesterday's closing prices. So, expectations before the opening of today's trading session are positive. Tech stocks may open higher following yesterday's better-than-expected Facebook, Inc. quarterly earnings release. The European stock market indexes have been mixed so far. Investors will wait for some economic data announcements: Initial Claims, Durable Goods Orders, Wholesale Inventories, Trade Balance at 8:30 a.m. Will the broad stock market bounce today? There may be some buying pressure ahead of several big cap tech stocks' after-hours quarterly earnings releases.
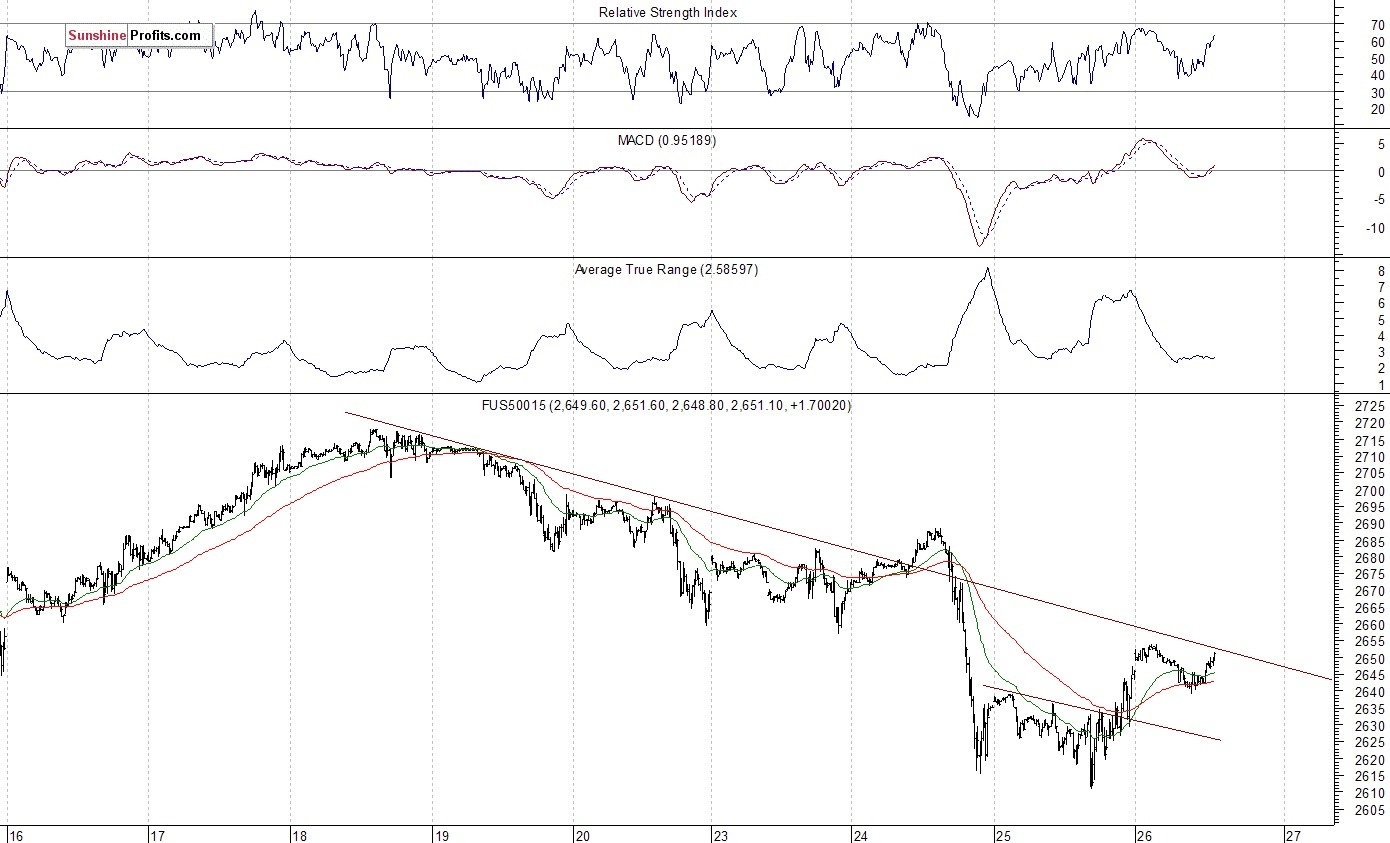
The S&P 500 futures contract trades within an intraday consolidation following overnight move up. The market retraces some of its Tuesday's move down, but it continues to trade below recent local lows. The nearest important level of resistance is at around 2,660, and the next resistance level is at 2,680-2,690, marked by recent local highs. On the other hand, support level is at 2,640, and the next level of support is at 2,610-2,620, marked by short-term local lows. The futures contract trades close to its short-term downward trend line, as the 15-minute chart shows:
Nasdaq Trades Along 6,600
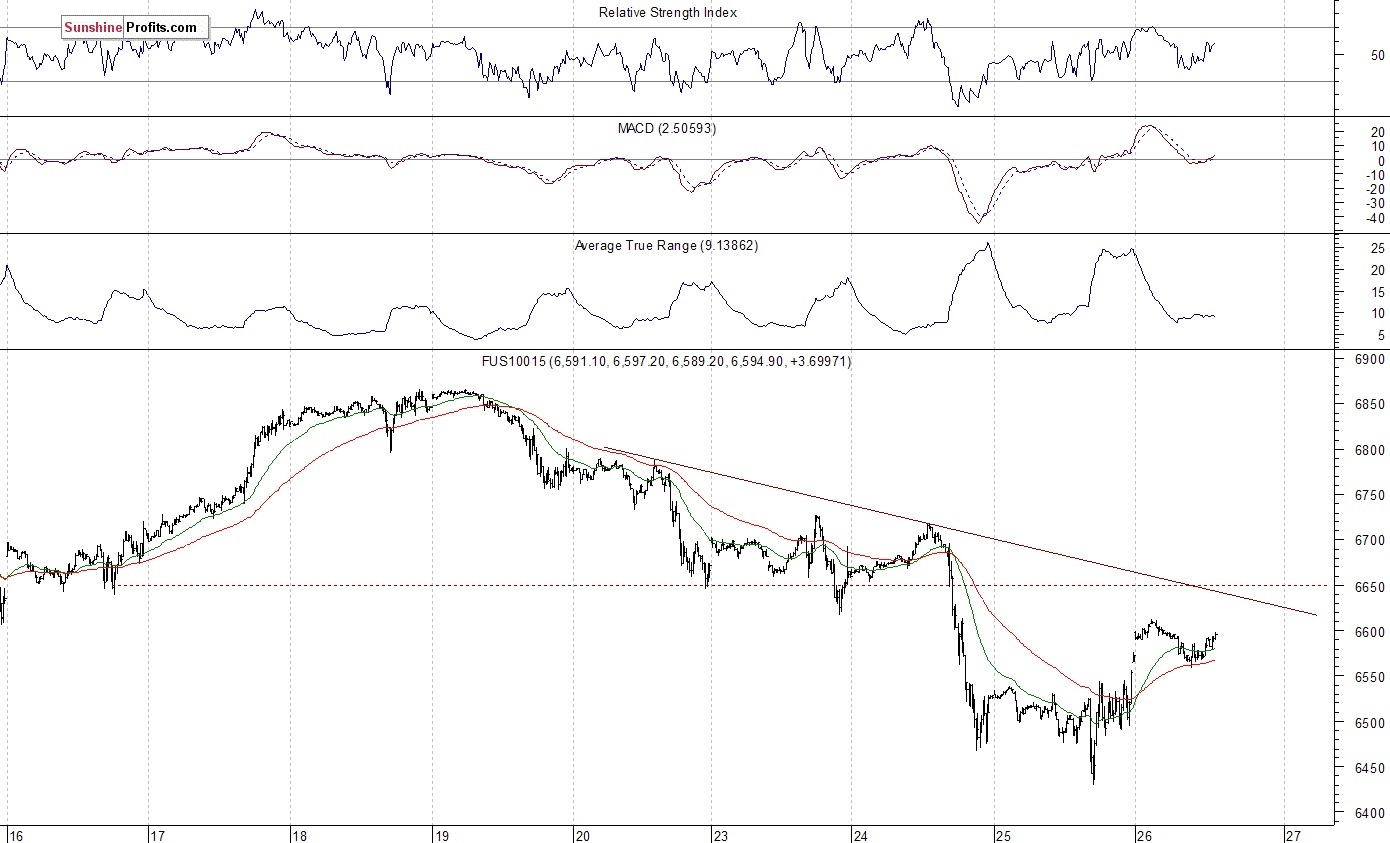
The technology Nasdaq 100 futures contract follows a similar path, as it trades within an intraday consolidation. Investors await series of quarterly earnings releases. The market retraced a part of its recent decline and it fluctuates along 6,600 mark. Volatility remains relatively high following yesterday's bounce off daily low at around 6,430. The nearest important level of resistance is at 6,610-6,620, and support level is at 6,550-6,560, among others. The Nasdaq futures contract retraced some of its recent move down, as we can see on the 15-minute chart:
Apple, Amazon: Uncertainty Ahead of Earnings Releases
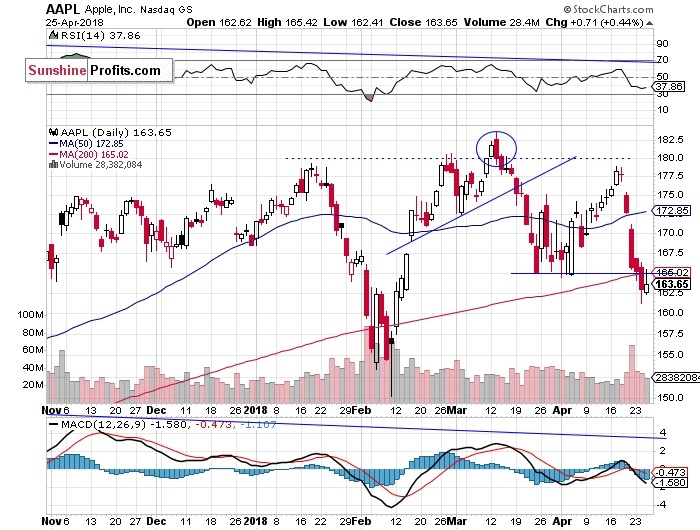
Let's take a look at Apple, Inc. stock (AAPL) daily chart (chart courtesy of http://stockcharts.com). It sold off on Friday, following Thursday's move down, and it broke below the support level of $165 on Tuesday. Apple will release its earnings report on May 1, so expectations before that release seem to be negative. Will we see some "sell the rumor, buy the fact" action? Potential support level is at around $160:
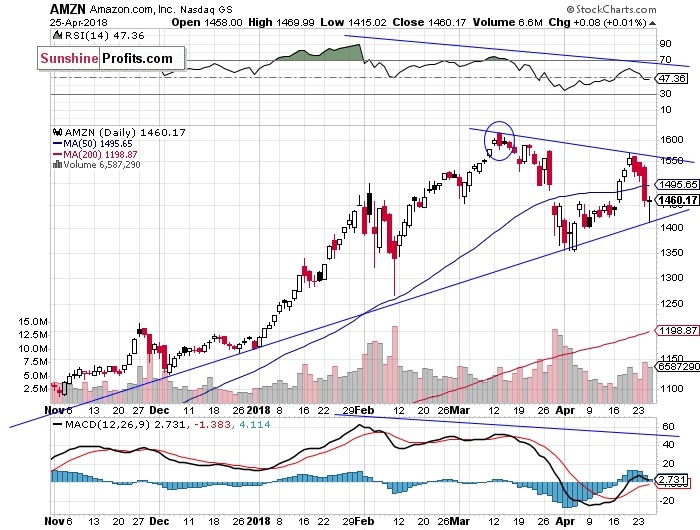
Now let's take a look at Amazon.com, Inc. stock (AMZN) daily chart. The price bounced off support level of medium-term upward trend line yesterday, following Tuesday's breakout below the price of $1,500. We can see a triangle pattern, as the stock trades below two-month-long downward trend line. Amazon will release its quarterly earnings report today, so we may see some volatility after-hours. The support level remains at around $1,400:
Dow Jones Still Below Medium-term Downward Trend Line
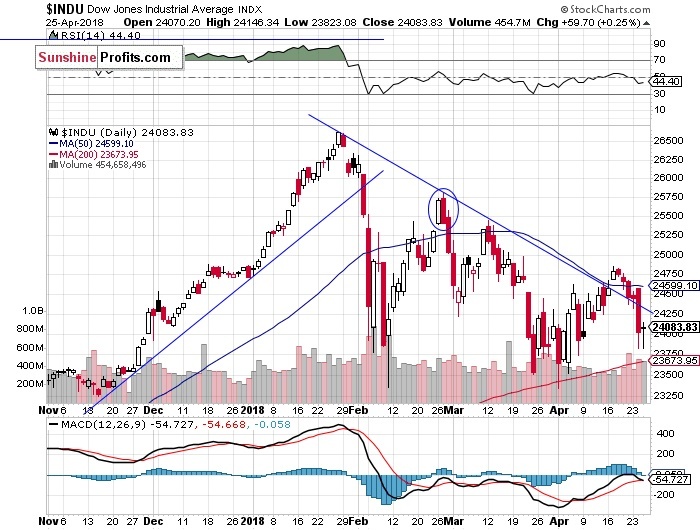
The Dow Jones Industrial Average came back below its medium-term downward trend line on Tuesday, as it invalidated its bullish scenario. The price bounced off resistance level of around 24,800-25,000 over a week ago. Will it get back to its late March - early April lows again? If it breaks below the level of 24,000, it could continue lower. Potential support level is at around 23,500. The blue-chip stocks' gauge fluctuated along the level of 24,000 yesterday:
The broad stock market retraced most of its early April move up in the last trading days. Is this a new downtrend or just quick downward correction? It looked like a correction on Tuesday, but the market accelerated its downtrend. So, medium-term bearish case is more likely again. Just like we wrote in our several Stocks Trading Alerts, the early February sell-off set the negative tone for weeks or months to come.
Concluding, the S&P 500 index will probably retrace some of its recent move down today. There have been no confirmed positive signals so far. Rising bond yields outweighed quarterly earnings releases on Tuesday, but we may see a rebound ahead of series of big tech cap earnings releases. The broad stock market index may keep bouncing off 2,600 mark.
Want free follow-ups to the above article and details not available to 99%+ investors? Sign up to our free newsletter today!
Author

Paul Rejczak
Sunshine Profits
Paul Rejczak is a stock market strategist who has been known for the quality of his technical and fundamental analysis since the late nineties.


