President Trump and the stock market in three charts
Donald Trump has been in office for less than a week but his initial political steeps have had a huge impact on markets and are likely to continue to do so.
Below we look at three charts, which highlight the impact of Donald Trump. We assess what they mean for markets going forward and how this could drive investment themes for the rest of Q1.
The S&P 500: Greater market breadth
Over the past month, the best performing sectors in the S&P 500 have included oil and gas, financials and industrials, which is a notable shift from the dominance of chip stocks for most of 2024. This suggests that the US stock market rally is broadening out, and the breadth that investors have wanted for so long is finally here.
60% of S&P 500 stocks are now above their200-day sma, compared with 45% of stocks on the Nasdaq, which is a sign that tech’s dominance could face a challenge this year. As you can see, the percentage of companies above their 200-day sma has been rising along with the Trump trade. Thus, a big part of the Trump trade so far has been a broadening out of the stock market rally.
Chart 1: S&P 500 and percentage of members above 10-day, 50-day and 200-day smas
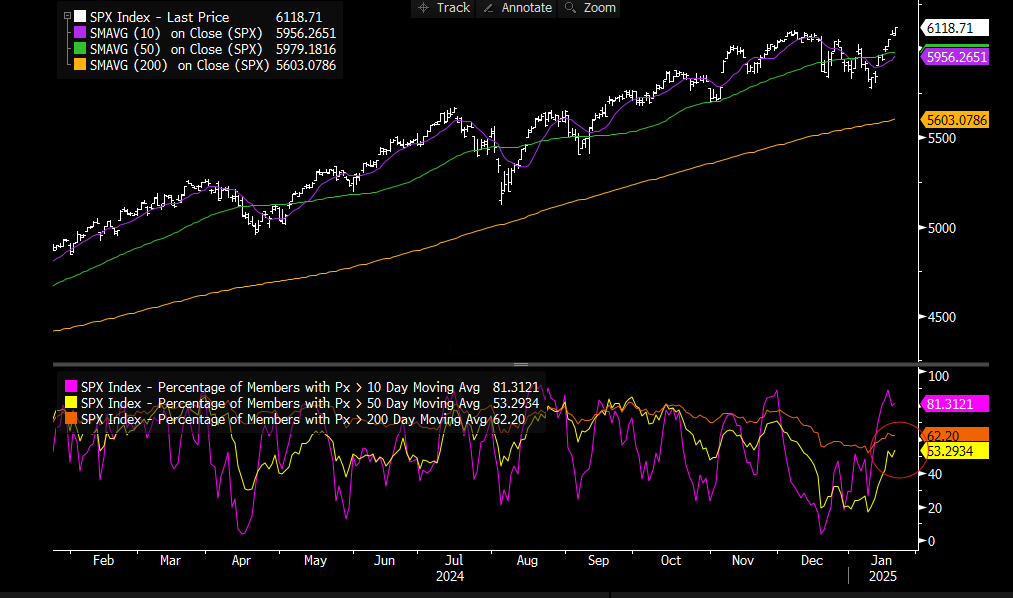
Source: XTB and Bloomberg
US interest rates
President Trump has made some controversial remarks about the Federal Reserve and his desire to see lower interest rates. The Federal Reserve is independent, and current Fed chair Jerome Powell’s term does not end until late 2026. Thus, we think that the Fed’s independence will be protected for the medium term.
In the past, remarks like that could have caused shock waves in the bond market. That has not been the case this time. The market realizes that what Trump says and what he does are two different things. He may want lower interest rates, what business person doesn’t, but it’s unlikely that he would intervene in the sanctity of the Federal Reserve and demand they do so.
Another feature of his Presidency so far has been a resilient bond market. 10-year yields are lower by 16 basis points since mid-January and have backed away from highs of 4.8%. This suggests two things: 1, some bond investors may think that Trump could have a disinflationary impact on the US economy, and 2, investors are taking a pragmatic approach to Trump 2.0.
The first point is worth noting. Trump has made clear his determination to lower the oil price. He is planning on boosting drilling for oil in the US, he has already boosted exports of LNG to Europe from the US, and he has directly asked Saudi Arabia to reduce the price of oil. All of this could be boosting global bond markets, even if he can’t force the Fed to lower interest rates. It is also having a positive impact on global risk sentiment.
The retreat in bond yields could also be down to a scaling back of fears about the US deficit and debt issuance. It is too early to tell if this is a permeant reduction in the term premium on US Treasuries, however, his pledges to cut spending and reduce the deficit could be gaining traction with bond investors.
Chart 2: US 10 -year bond yield
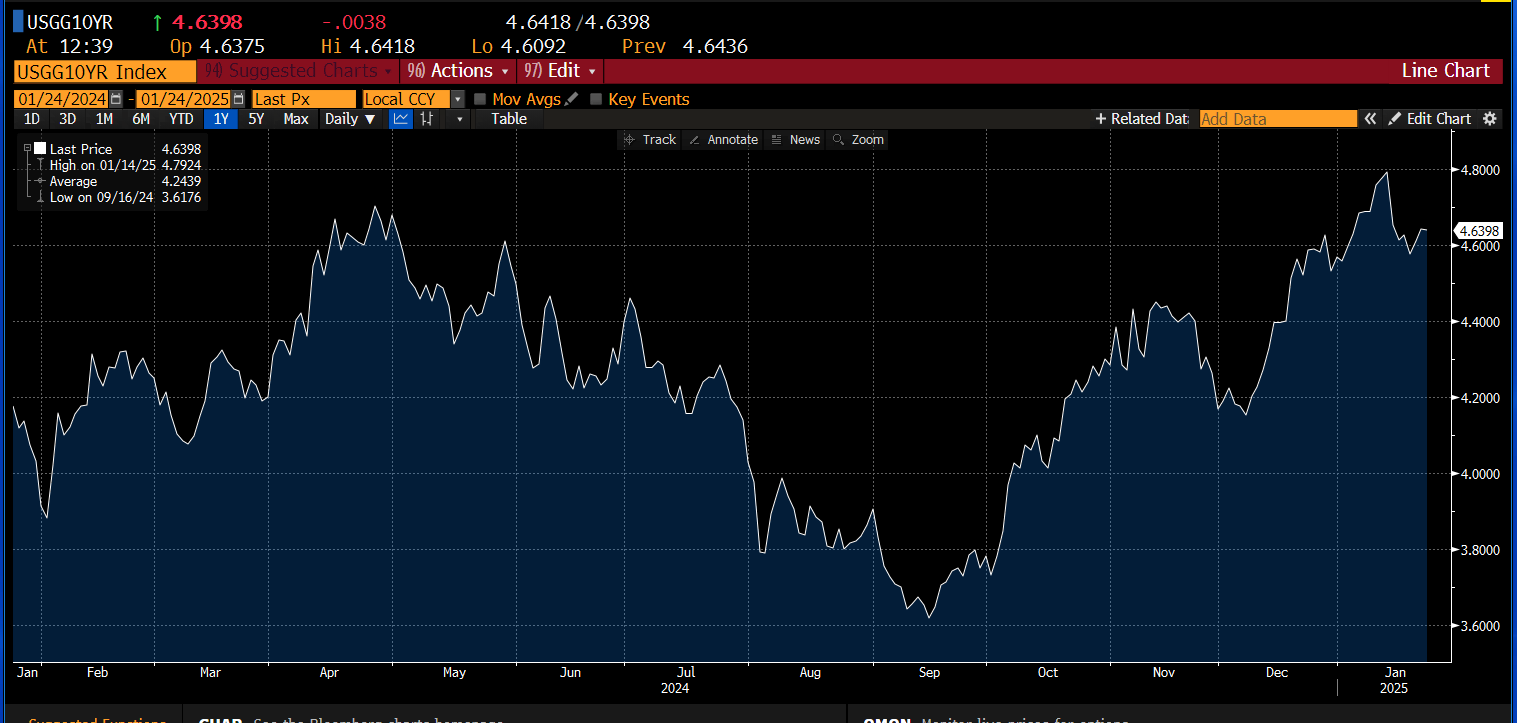
Source: XTB and Bloomberg
The tariff trade unwind
Trump’s bark is worse than its bite when it comes to tariffs. Earlier this week he said that the US would impose a 10% tariff on Chinese goods, which is much lower than the 60% rate he had threatened ahead of his inauguration. On Thursday night he said that he did not want to impose tariffs on China at all. He has also failed to specify tariffs for EU imports to the US, although he has brought up the Eurozone’s trade surplus with the US as a problem.
In these early days of the Trump administration, it appears that tariffs on China and the EU may not be his top priority. Of course, things could change, but for now this is sparking a rally in EM FX, it has allowed the BOJ to hike interest rates without causing a major bout of volatility in the yen and it could allow global ex US stocks a chance to play catch up to the US, as the tariff trade is unwound. As you can see, the main Chinese CSI 300 index, the MSCI EM index and the Eurostoxx index have all struggled since the start of the Trump trade back in October. However, now that President Trump is in office, these stock indices are in recovery mode. We will be watching to see if this continues.
Chart 3: MSCI EM index, CSI 300 and Eurostoxx 600 index, all normalized to show how they move together.
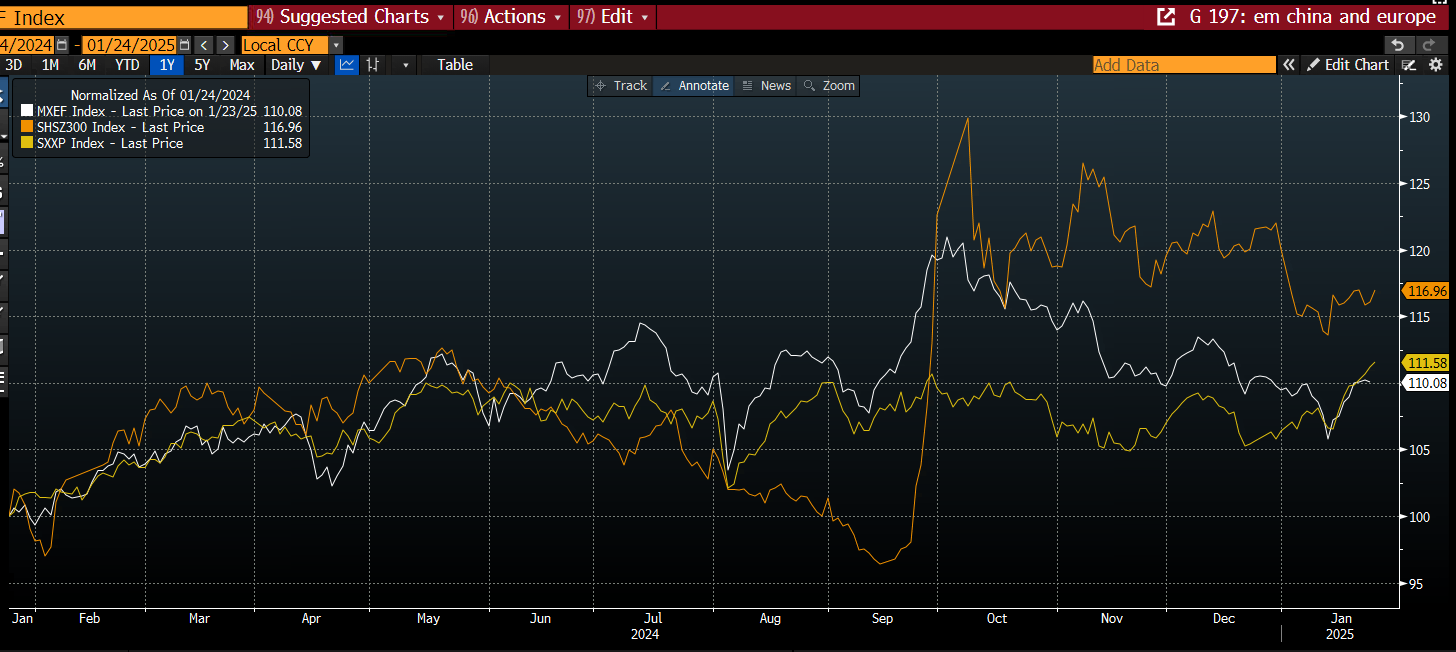
Source: XTB and Bloomberg
Author

Kathleen Brooks
XTB UK
Kathleen has nearly 15 years’ experience working with some of the leading retail trading and investment companies in the City of London.