Powell talk propels markets

USD: Sept '25 is Up at 97.880.
Energies: Sep '25 Crude is Up at 64.08.
Financials: The Sep '25 30 Year T-Bond is Lower by 16 ticks and trading at 114.11.
Indices: The Sep '25 S&P 500 emini ES contract is 80 ticks Lower and trading at 6463.25.
Gold: The Dec'25 Gold contract is trading Down at 3410.30.
Initial conclusion
This is not a correlated market. The USD is Up and Crude is Up which is not normal, and the 30 Year T-Bond is trading Lower. The Financials should always correlate with the US dollar such that if the dollar is Higher, then the bonds should follow and vice-versa. The S&P is Lower and Crude is trading Higher which is correlated. Gold is trading Lower which is correlated with the US dollar trading Up. I tend to believe that Gold has an inverse relationship with the US Dollar as when the US Dollar is down, Gold tends to rise in value and vice-versa. Think of it as a seesaw, when one is up the other should be down. I point this out to you to make you aware that when we don't have a correlated market, it means something is wrong. As traders you need to be aware of this and proceed with your eyes wide open. All of Asia traded Higher. Currently Europe is trading Mixed.
Possible challenges to traders
- New Home Sales is out at 10 AM EST. This is Major.
- FOMC Member Logan Speaks at 3:15 PM EST. This is Major.
Traders, please note that we've changed the Bond instrument from the 10 Year (ZN) to the 2 Year (ZT). They work exactly the same.
We've elected to switch gears a bit and show correlation between the 2-year Treasury notes (ZT) and the S&P futures contract. The YM contract is the Dow Jones Industrial Average, and the purpose is to show reverse correlation between the two instruments. Remember it's likened to a seesaw, when up goes up the other should go down and vice versa.
On Friday the ZT climbed Higher at around 7:30 AM EST with no news pending. The Dow dived Lower at the same time. Look at the charts below and you'll see a pattern for both assets. The Dow dived Lower at around 7:30 AM EST and the ZT climbed Higher at around the same time. These charts represent the newest version of Bar Charts, and I've changed the timeframe to a 15-minute chart to display better. This represented a Long opportunity on the 2-year note, as a trader you could have netted about 20 plus ticks per contract on this trade. Each tick is worth $6.25. Please note: the front month for ZT is now Sep '25 and the Dow is now Sep '25. I've changed the format to filled Candlesticks (not hollow) such that it may be more apparent and visible.
Charts courtesy of barcharts

ZT -Sep 25 - 8/22/25
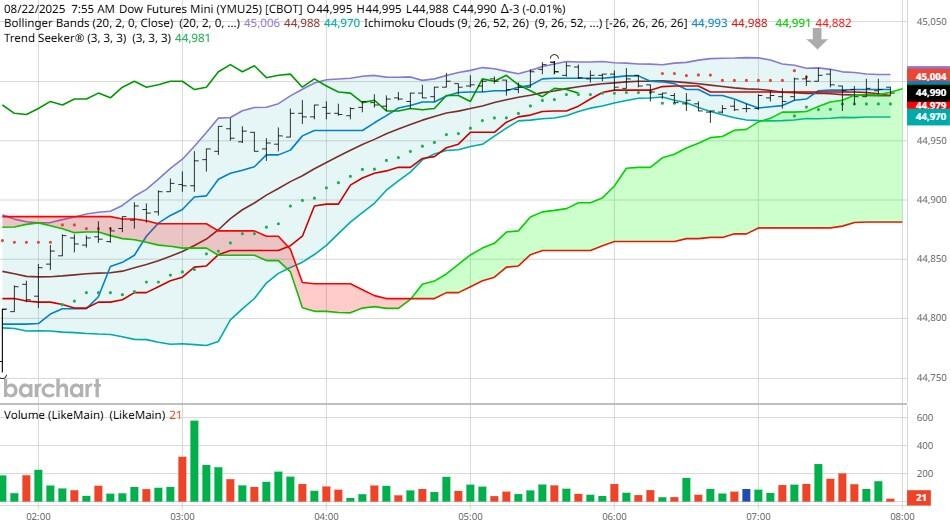
Dow - Sep 2025- 8/22/25
Bias
On Friday we gave the markets a Neutral or Mixed bias which means the markets could go anywhere and it climbed Higher. The Dow gained an astounding 846 points on the session and the other indices gained ground as well. Today we aren't dealing with a correlated market, and our bias is to the Dpwnside.
Could this change? Of Course. Remember anything can happen in a volatile market.
Commentary
So everyone was waiting with abated breath on Friday to hear what Fed Chair Powell would say regarding the US economy. What he said was the current situation requires examination and the markets took that as a signal for rate reductions. However, he never said or committed to that. Regardless the Dow gained in excess of 800 points and teh other indices gained as well.
Author

Nick Mastrandrea
Market Tea Leaves


