Powell speaks…again [Video]
![Powell speaks…again [Video]](https://editorial.fxstreet.com/images/Macroeconomics/CentralBanks/FED/Jerome_Powell5_XtraLarge.jpg)
US Dollar: Dec '20 USD Down at 91.040.
Energies: Jan'21 Crude is Down at 45.05.
Financials: The Mar '21 30 year bond is Up 9 ticks and trading at 172.14.
Indices: The Dec S&P 500 emini ES contract is 24 ticks Lower and trading at 3662.00.
Gold: The Dec'20 Gold contract is trading Up at 1840.80 Gold is 106 ticks Higher than its close.
Initial Conclusion
This is not a correlated market. The dollar is Down- and Crude is Down- which is not normal but the 30 year Bond is trading Higher. The Financials should always correlate with the US dollar such that if the dollar is lower then bonds should follow and vice-versa. The S&P is Lower and Crude is trading Lower which is not correlated. Gold is trading Higher which is correlated with the US dollar trading Down-.I tend to believe that Gold has an inverse relationship with the US Dollar as when the US Dollar is down, Gold tends to rise in value and vice-versa. Think of it as a seesaw, when one is up the other should be down. I point this out to you to make you aware that when we don't have a correlated market, it means something is wrong. As traders you need to be aware of this and proceed with your eyes wide open.
Asia traded Higher with with the exception of the Shanghai exchange which traded Lower.All of Europe is trading Lower at this time.
Possible Challenges To Traders Today
-
Challenger Jobs Cuts is out at 7:30 AM EST. Major.
-
Unemployment Claims are out at 8:30 AM EST. Major
-
Final Services PMI is out at 9:45 AM EST. This is Major.
-
ISM Services PMI is out at 10 AM EST. This is Major.
-
Natural Gas Storage is out at 10:30 AM EST. This is Major.
Treasuries
Traders please note that we've changed the Bond instrument from the 30 year (ZB) to the 10 year (ZN). They work exactly the same.
We've elected to switch gears a bit and show correlation between the 10 year bond (ZN) and The S&P futures contract. The S&P contract is the Standard and Poor's and the purpose is to show reverse correlation between the two instruments.Remember it's liken to a seesaw, when up goes up the other should go down and vice versa.
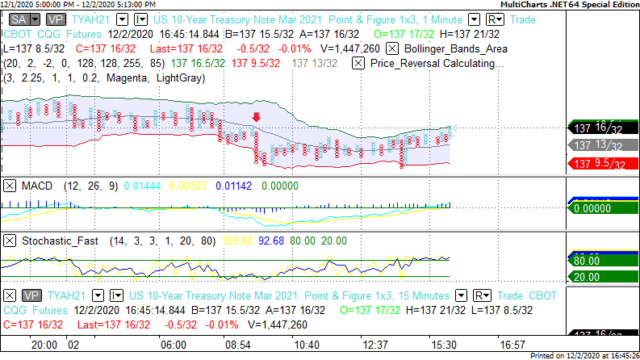
Yesterday the ZN made it's move at around 10 AM EST. The ZN hit a High at around that time and the S&P moved Higher. If you look at the charts below ZN gave a signal at around 10 AM EST and the S&P moved Higher at around the same time. Look at the charts below and you'll see a pattern for both assets. ZN hit a High at around 10 AM EST and the S&P was moving Higher shortly thereafter. These charts represent the newest version of MultiCharts and I've changed the timeframe to a 15 minute chart to display better. This represented a Shorting opportunity on the 10 year note, as a trader you could have netted about a dozen ticks per contract on this trade. Each tick is worth $15.625. Please note: the front month for the ZN is now Mar '21. The S&P contract is also Dec '20 as well. I've changed the format to Renko bars such that it may be more apparent and visible.
Charts Courtesy of MultiCharts built on an AMP platform
-637425887889050503.png)
Bias
Yesterday we gave the markets a Downside bias as the USD and the Bonds were both trading Higher and this is usually indicative of a Downside day. The markets had other ideas as the Dow traded 60 points Higher, The S&P 7 points Higher but the Nasdaq did trade 6 points Lower. Today we aren't dealing with a correlated market and our bias is Neutral.
Could this change? Of Course.Remember anything can happen in a volatile market.
Commentary
Yesterday morning the markets were correlated to the Downside as the USD, the Bonds and Gold were all pointed Higher Wednesday morning. Whereas this is usually indicative of a Downside day we did mention in our video to subscribers that Chair Powell would be testifying again and this could have an impact on market direction. As it turns out both Speaker Pelosi and Chuck Shumer have agreed that the 908 billion dollar package offered by the GOP would be the basis for discussions. However Mitch McConnell is dead set against anything Higher. The Senate has had the CARES bill passed by the house since May 15th and have done nothing with it. The only to get anything passed rapidly would be to get rid of Mitch McConnell as Senate Majority Leader. The way to do that is to vote Democratic in the upcoming Georgia runoff elections. Whether this in fact happens; only time will tell....
Author

Nick Mastrandrea
Market Tea Leaves


