Powell comments sink markets

USD: Dec '24 is Down at 106.430.
Energies: Dec '24 Crude is Down at 68.48.
Financials: The Dec '24 30 Year T-Bond is Down 10 ticks and trading at 116.08.
Indices: The Dec '24 S&P 500 emini ES contract is 128 ticks Lower and trading at 5946.25.
Gold: The Dec'24 Gold contract is trading Down at 2570.90.
Initial conclusion
This is not a correlated market. The USD is Down and Crude is Down which is not normal, and the 30 Year T-Bond is trading Lower. The Financials should always correlate with the US dollar such that if the dollar is Higher, then the bonds should follow and vice-versa. The S&P is Lower and Crude is trading Lower which is not correlated. Gold is trading Lower which is not correlated with the US dollar trading Down. I tend to believe that Gold has an inverse relationship with the US Dollar as when the US Dollar is down, Gold tends to rise in value and vice-versa. Think of it as a seesaw, when one is up the other should be down. I point this out to you to make you aware that when we don't have a correlated market, it means something is wrong. As traders you need to be aware of this and proceed with your eyes wide open. Asia traded Mixed with half the exchanges Higher and the other half Lower. All of Europe is trading Lower with the exception of the Spanish Ibex exchange.
Possible challenges to traders
-
Core Retail Sales m/m is out at 8:30 AM EST. This is Major.
-
Retail Sales m/m is out at 8:30 AM EST. This is Major.
-
Empire State Manufacturing Index is out at 8:30 AM EST. This is Major.
-
Import Prices m/m are out at 8:30 AM EST. This is Major.
-
FOMC Member Collins Speaks at 9 AM EST. This is Major.
-
Capacity Utilization Rate is out at 9:15 AM EST. This is Major.
-
Industrial Production m/m is out at 9:15 AM EST. This is Major.
-
Business Inventories are out at 10 AM EST. This is Major.
-
FOMC member Williams Speaks at 3 PM EST. This is Major.
Traders, please note that we've changed the Bond instrument from the 10 year (ZN) to the 2 year (ZT). They work exactly the same.
We've elected to switch gears a bit and show correlation between the 2-year Treasury notes (ZT) and the S&P futures contract. The YM contract is the Dow Jones Industrial Average, and the purpose is to show reverse correlation between the two instruments. Remember it's likened to a seesaw, when up goes up the other should go down and vice versa.
Yesterday the ZT migrated Higher at around 8:30 AM EST with the PPI numbers reported at that time reported at that time. The Dow dived Lower at the same time. Look at the charts below and you'll see a pattern for both assets. The Dow moved Lower at 8:30 AM and the ZT moved Higher at around the same time. These charts represent the newest version of Bar Charts, and I've changed the timeframe to a 15-minute chart to display better. This represented a Long opportunity on the 2-year note, as a trader you could have netted about 50 ticks per contract on this trade. Each tick is worth $7.625. Please note: the front month for ZT is Dec and the Dow is now Dec '24. I've changed the format to filled Candlesticks (not hollow) such that it may be more apparent and visible.
Charts courtesy of barcharts
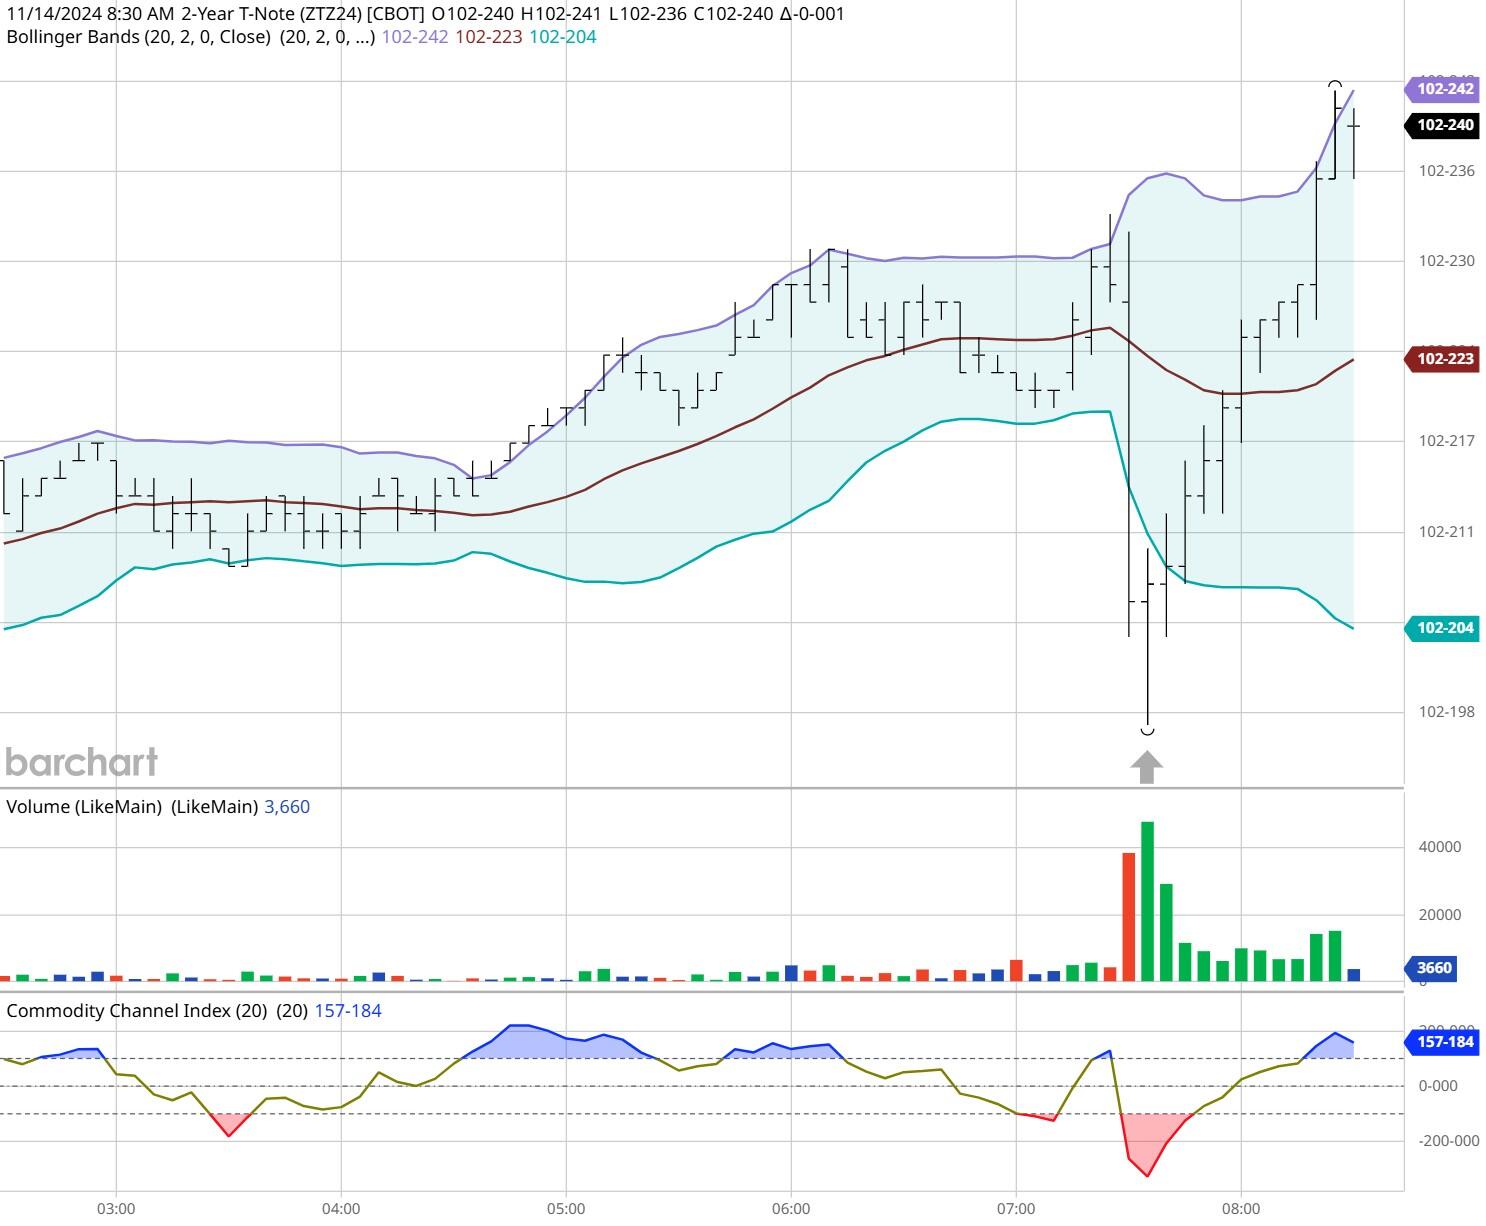
ZT -Dec 2024 - 11/14/24
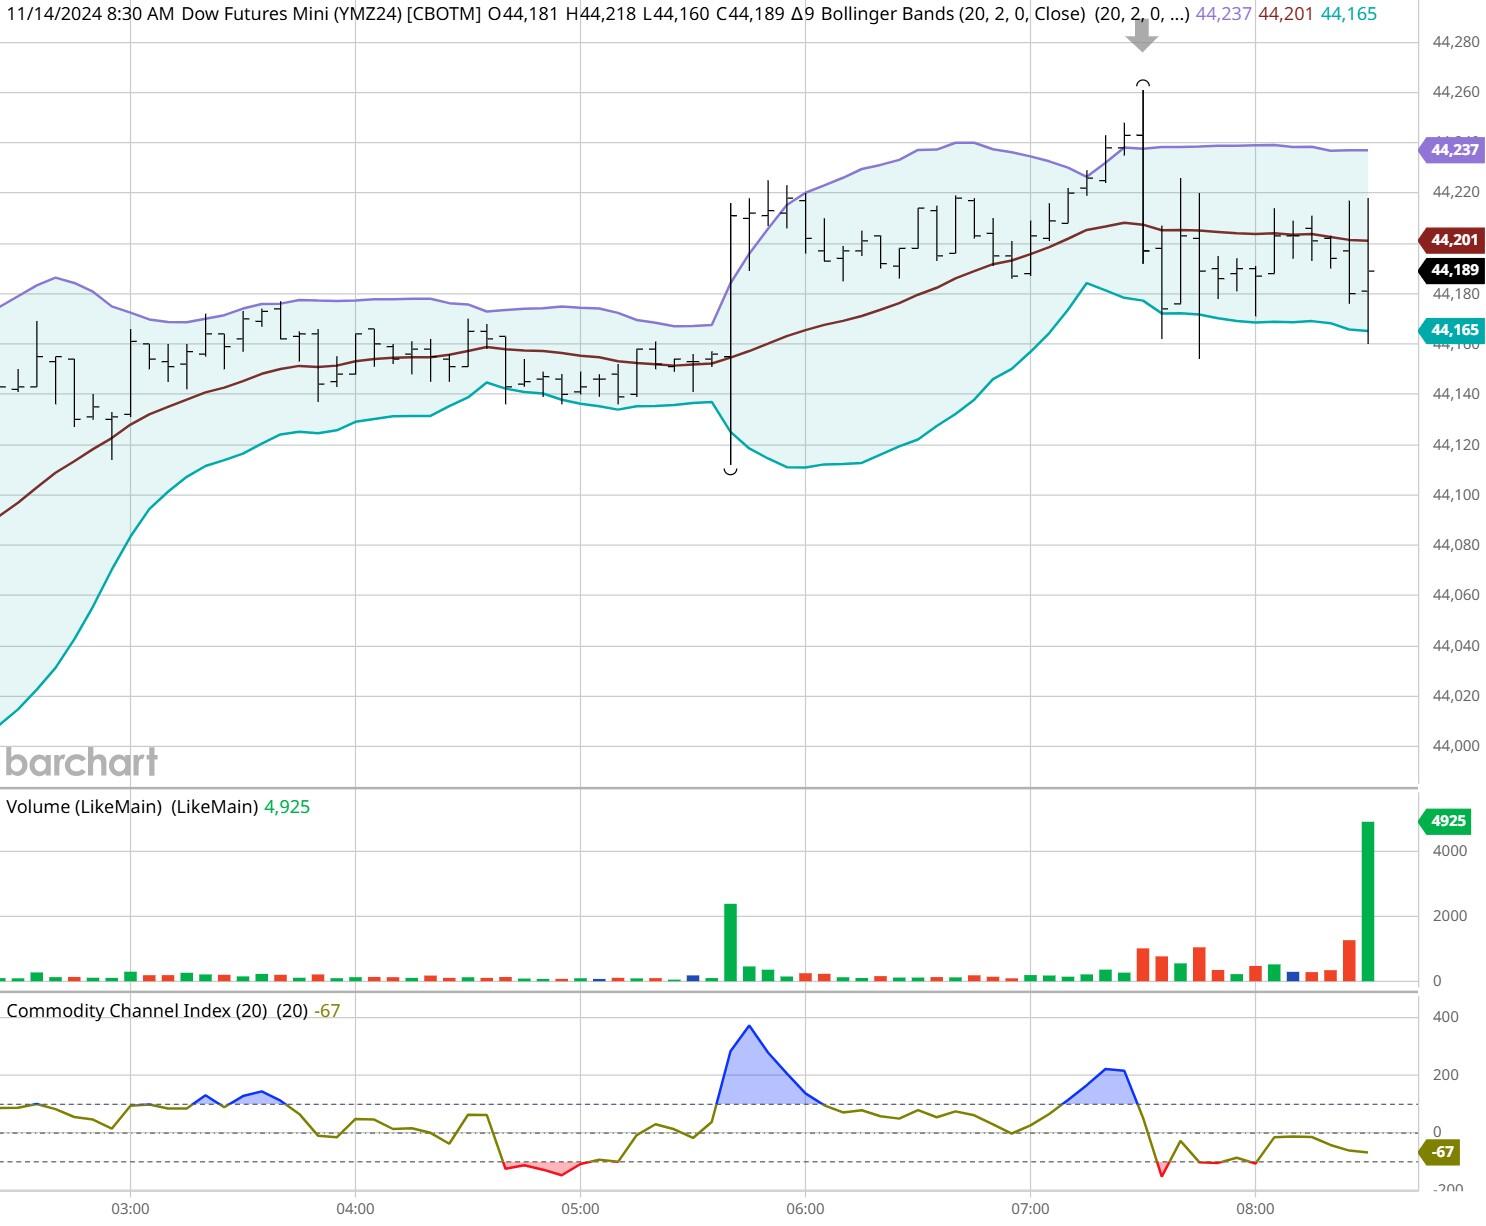
Dow - Dec 2024- 11/14/24
Bias
Yesterday we gave the markets a Neutral or Mixed bias, but the markets had other ideas. The Dow closed Lower by 207 points and the other indices traded Lower as well. Today we aren't dealing with a correlated market as all instruments are Lower at the present time as such our bias is Neutral or Mixed.
Could this change? Of Course. Remember anything can happen in a volatile market.
Commentary
Yesterday the Fed Chair Powell had mentioned that the Federal Reserve wasn't in any hurry to lower interest rates, and this sent the markets on a tailspin with all major indices Lower. This really set the markets back as everyone was expecting an interest rate reduction especially given that we are approaching the Holiday Season fast and this is the major spending for the year. Today we have Retail Sales numbers as well as the Empire State Manufacturing index. These are all major and proven market movers. Will this change market direction? Only time will tell.
Author

Nick Mastrandrea
Market Tea Leaves
Nick Mastrandrea over 20 years experience in trading and formerly held a NASD Series 7. He currently holds a NJ Life, Health and Variable Authority. Nick is a published writer and his work has appeared in Futures Magazine, TraderPlanet and others.


